Fig. B.1
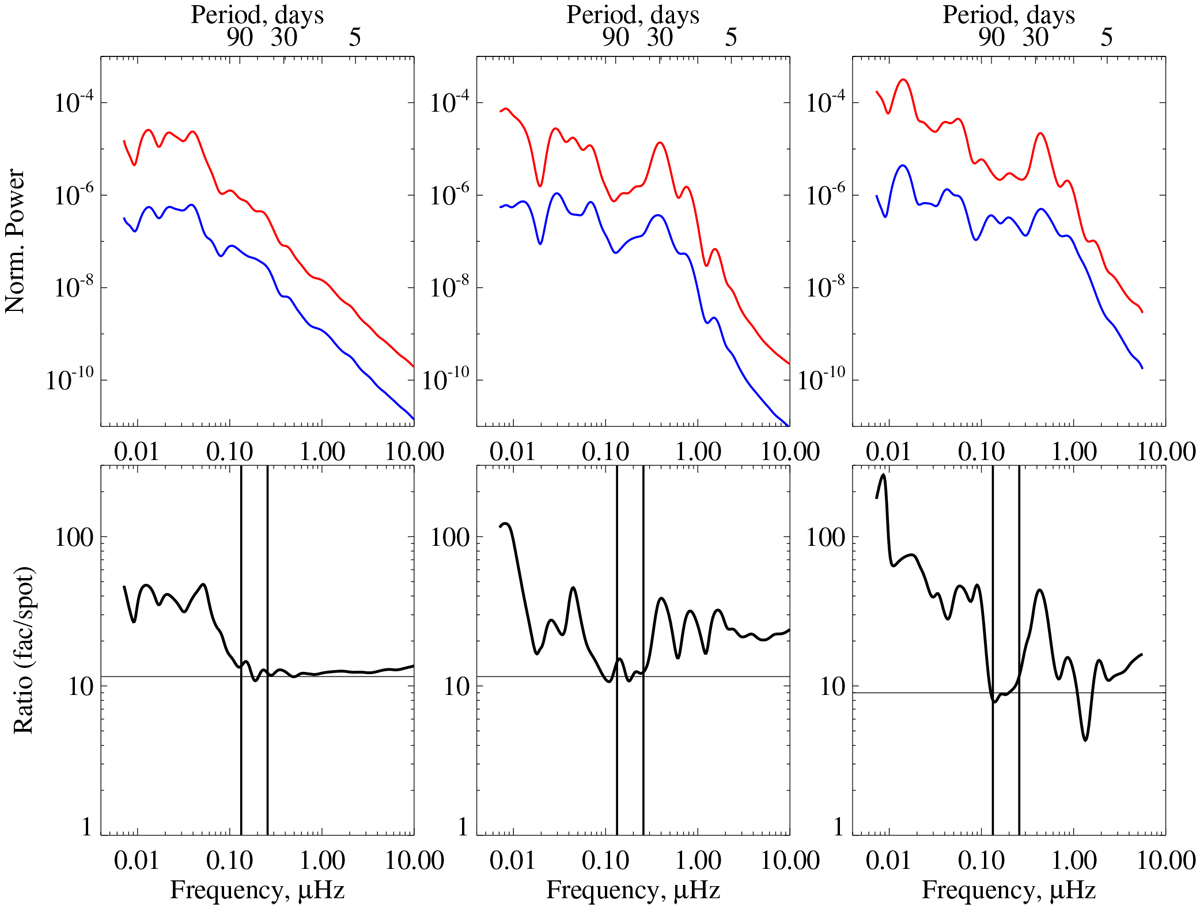
Power spectra of facular (red) and spot (blue) disk area coverages for modeled star observed along its rotational axis (left upper panel), modeled star observed from its equatorial plane (middle upper panel), and for Sun deduced from SDO/HMI observations (right upper panel). Corresponding ratios between the power spectra of facular and spot disk area coverages are plotted in the lower panels. Vertical black lines in the lower panel denote the interval between 45 and 90 days. Horizontal black line in the left and middle lower panel denotes the ![]() value used in the simulations (see text for more details). Horizontal black line in the right lower panels denotes ratio value of 9.
value used in the simulations (see text for more details). Horizontal black line in the right lower panels denotes ratio value of 9.
Current usage metrics show cumulative count of Article Views (full-text article views including HTML views, PDF and ePub downloads, according to the available data) and Abstracts Views on Vision4Press platform.
Data correspond to usage on the plateform after 2015. The current usage metrics is available 48-96 hours after online publication and is updated daily on week days.
Initial download of the metrics may take a while.