Open Access
Fig. A.3
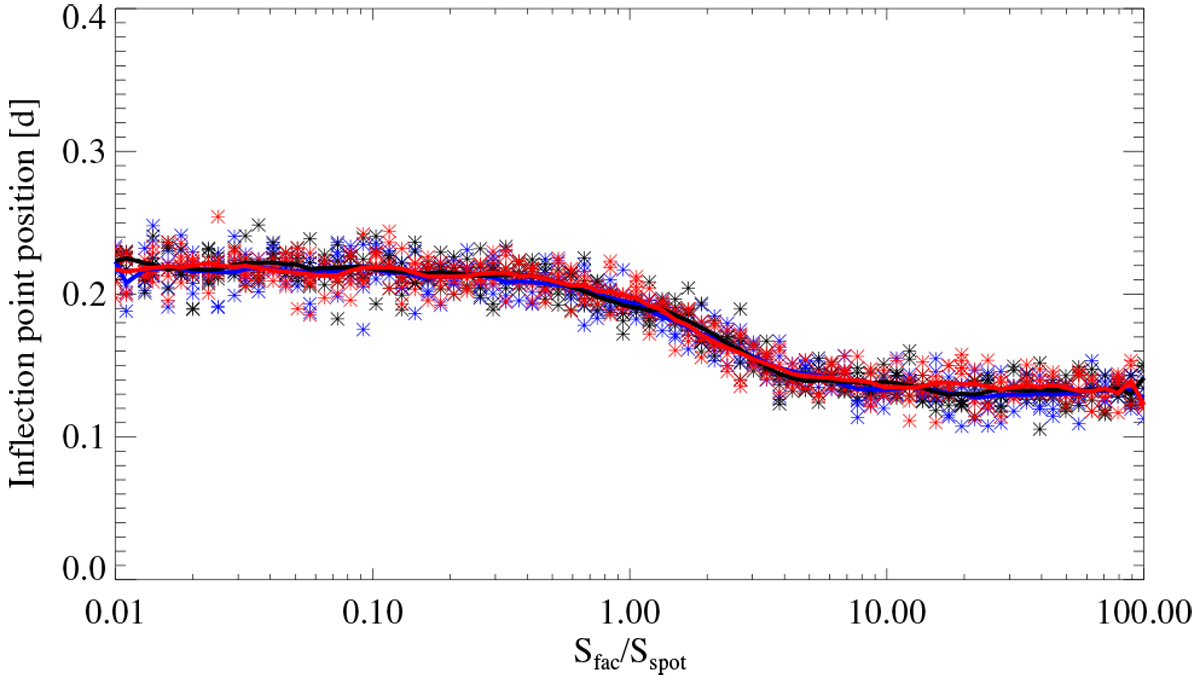
Same as Fig. 8, but for three values of mean fractional disk-area spot coverage: 0.075% (blue), 0.3% (black), and 0.75% (red). Calculations are performed for spot decay rate of 25 MSH day−1, Tfac ∕Tspot = 3 and rotation period of 30 d.
Current usage metrics show cumulative count of Article Views (full-text article views including HTML views, PDF and ePub downloads, according to the available data) and Abstracts Views on Vision4Press platform.
Data correspond to usage on the plateform after 2015. The current usage metrics is available 48-96 hours after online publication and is updated daily on week days.
Initial download of the metrics may take a while.