Fig. A.2
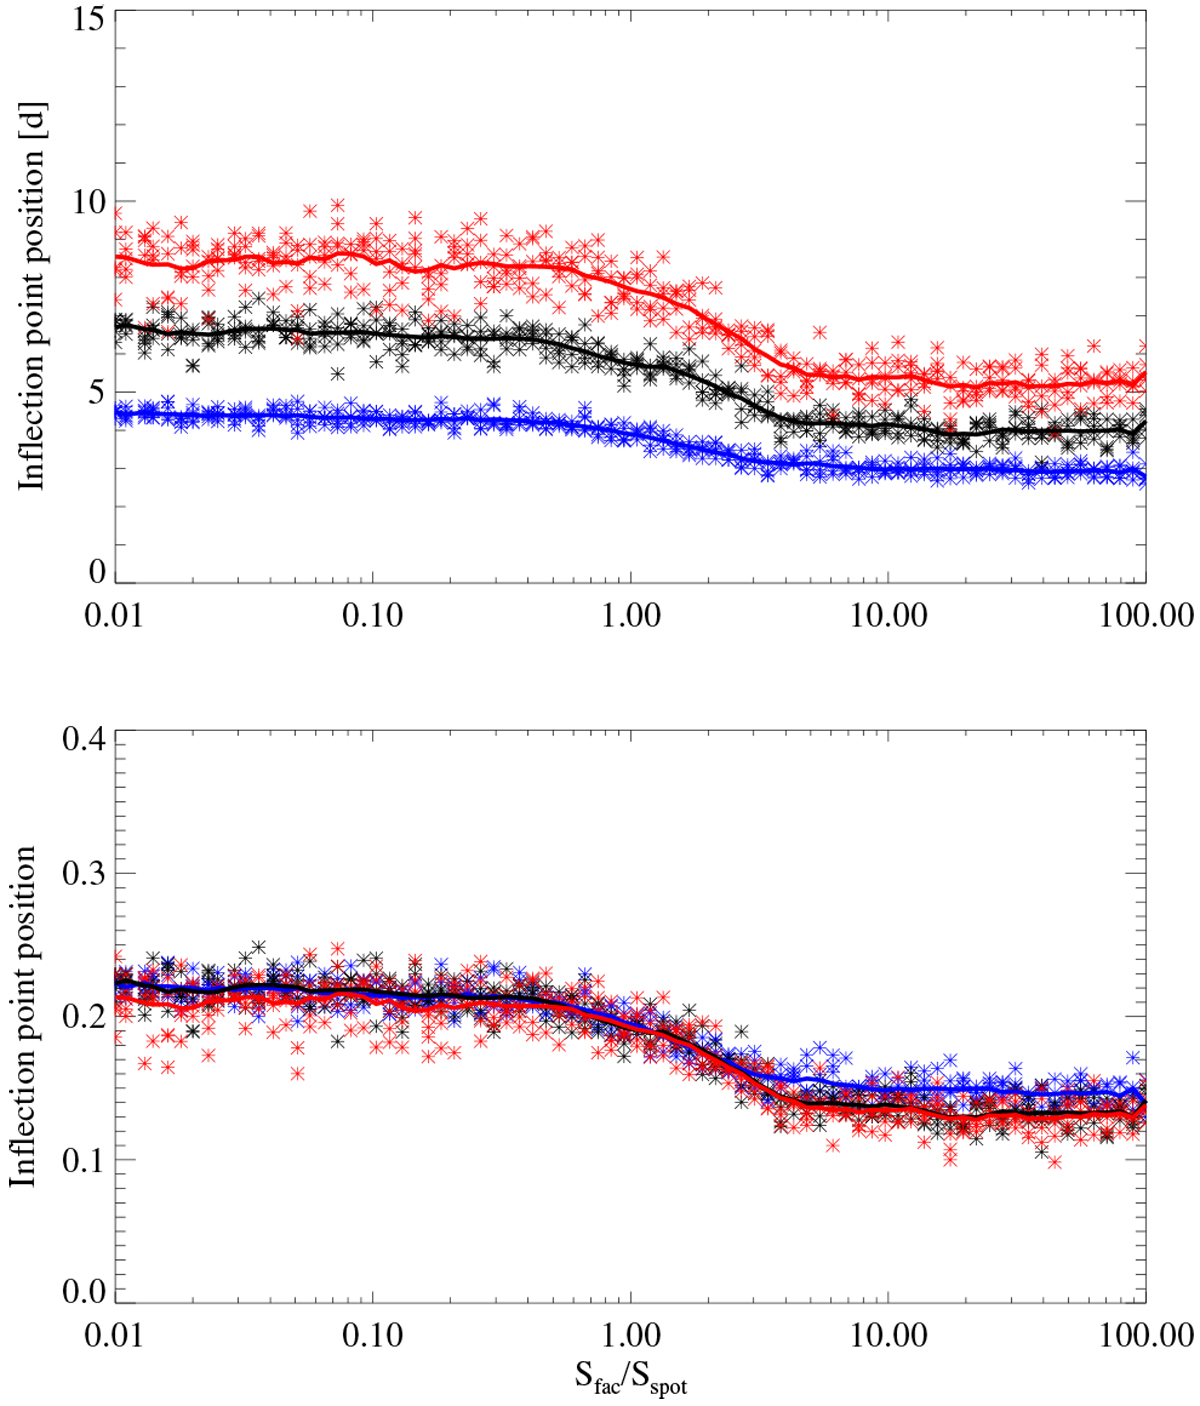
Dependences of inflection point position on ratio between facular and spot disk-area coverage at the time of maximum area, Sfac∕Sspot, plotted for three values of the rotation period: 20 d (blue), 30 d (black), and 40 days (red). Shown are positions in days (upper panel) and ratios with respect to the rotation period (lower panel). Calculations are performed for a spot decay rate of 25 MSH day−1, Tfac ∕Tspot = 3, and mean fractional disk-area spot coverage of 0.3%. As in Figs. 8–9 for each pair of Sfac ∕Sspot and rotation periods values, five realization of active regions emergences are shown. Red, black, and blue lines indicate positions of the inflection points averaged over corresponding five realizations. A small deviation of 20 d curve from 30 d and 40 d curves in the lower panel at high Sfac ∕Sspot values can be explained by the insufficient cadence of light curves (4 points per day) for 20 d rotation period and aliasing effect.
Current usage metrics show cumulative count of Article Views (full-text article views including HTML views, PDF and ePub downloads, according to the available data) and Abstracts Views on Vision4Press platform.
Data correspond to usage on the plateform after 2015. The current usage metrics is available 48-96 hours after online publication and is updated daily on week days.
Initial download of the metrics may take a while.