Fig. A.1
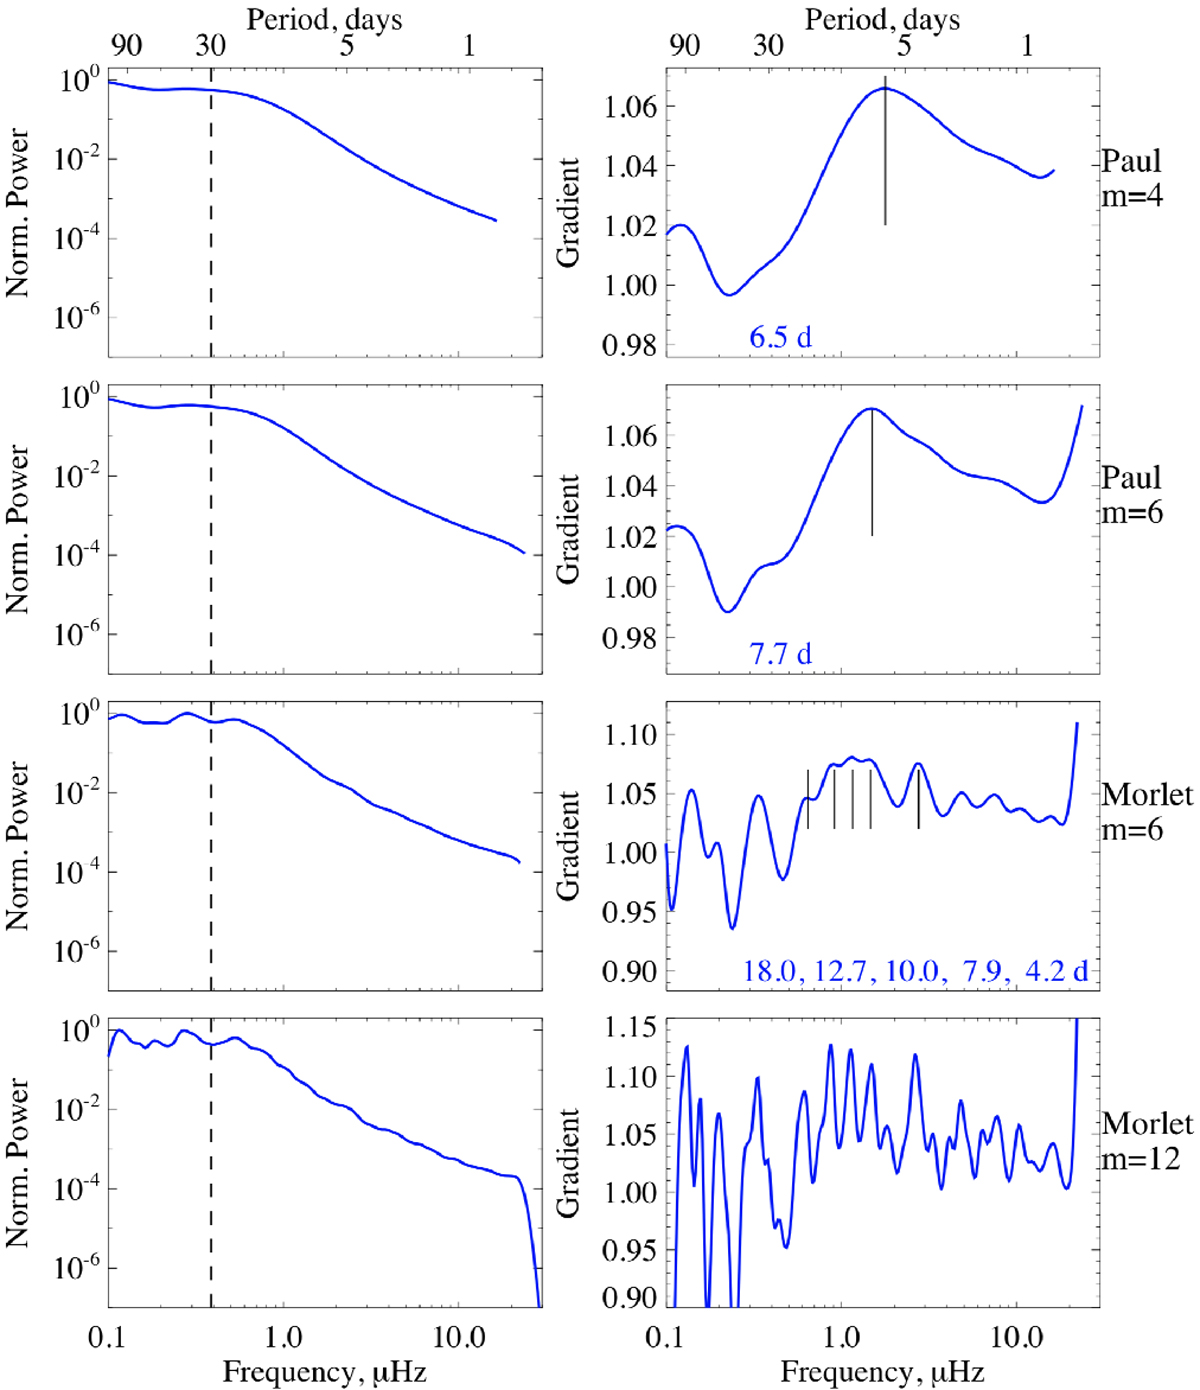
Global wavelet power spectra (left panels) of light curve from Fig. 1 and corresponding gradients of power spectra (right panels) calculated with different wavelets. The frequency localization of the utilized wavelet is increasing from the top to bottom panels. As in Fig. 1, vertical dashed lines in the left panels indicate the rotation period of the modeled star. Vertical solid lines and numbers in the right panels (not shown in the bottom panel) indicate the positions of the inflection points.
Current usage metrics show cumulative count of Article Views (full-text article views including HTML views, PDF and ePub downloads, according to the available data) and Abstracts Views on Vision4Press platform.
Data correspond to usage on the plateform after 2015. The current usage metrics is available 48-96 hours after online publication and is updated daily on week days.
Initial download of the metrics may take a while.