Fig. 11
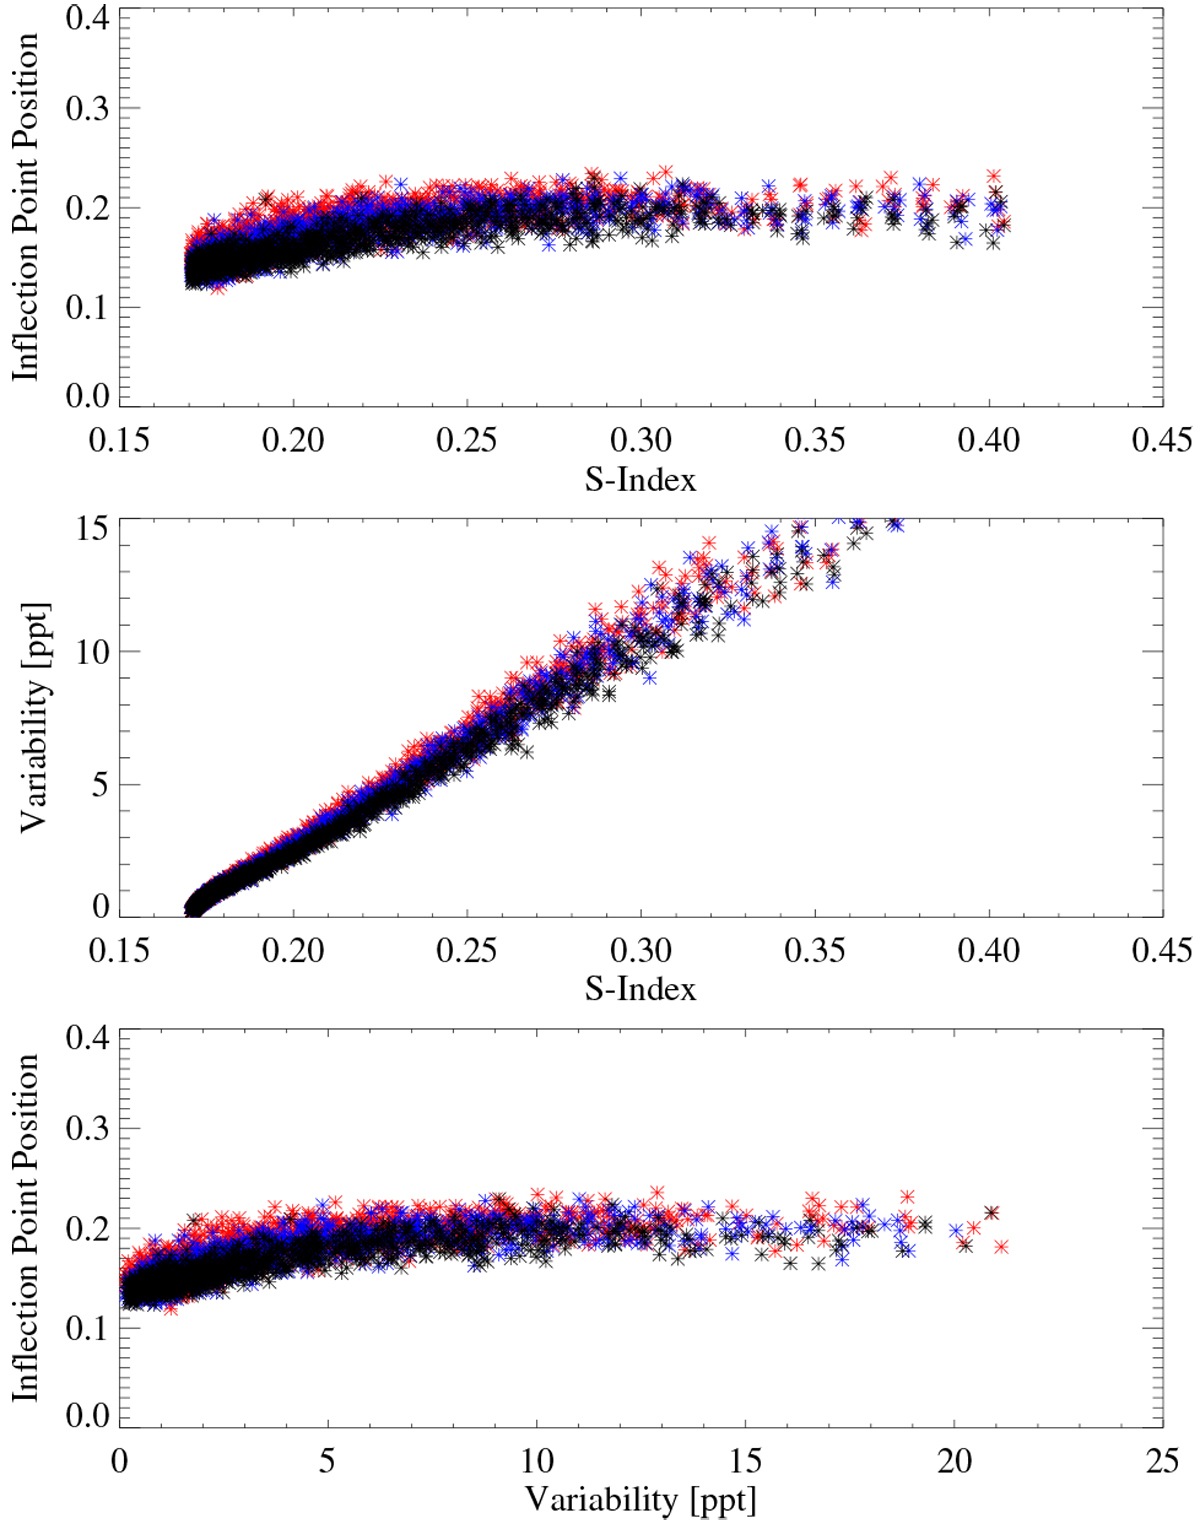
Same dependences as in Fig. 10 but computed for nine pairs of spot decay rates andratios between facular and spot lifetimes. For each pair of these parameters, calculations are performed for five realizations of active regions emergences. Shown are calculations with Tfac ∕Tspot = 2 (black), Tfac∕Tspot = 3 (blue), and Tfac∕Tspot = 5 (red). For each Tfac∕Tspot ratio, we perform calculations with three values of spot decay rates: 41, 25, and 10 MSH day−1.
Current usage metrics show cumulative count of Article Views (full-text article views including HTML views, PDF and ePub downloads, according to the available data) and Abstracts Views on Vision4Press platform.
Data correspond to usage on the plateform after 2015. The current usage metrics is available 48-96 hours after online publication and is updated daily on week days.
Initial download of the metrics may take a while.