Fig. 10
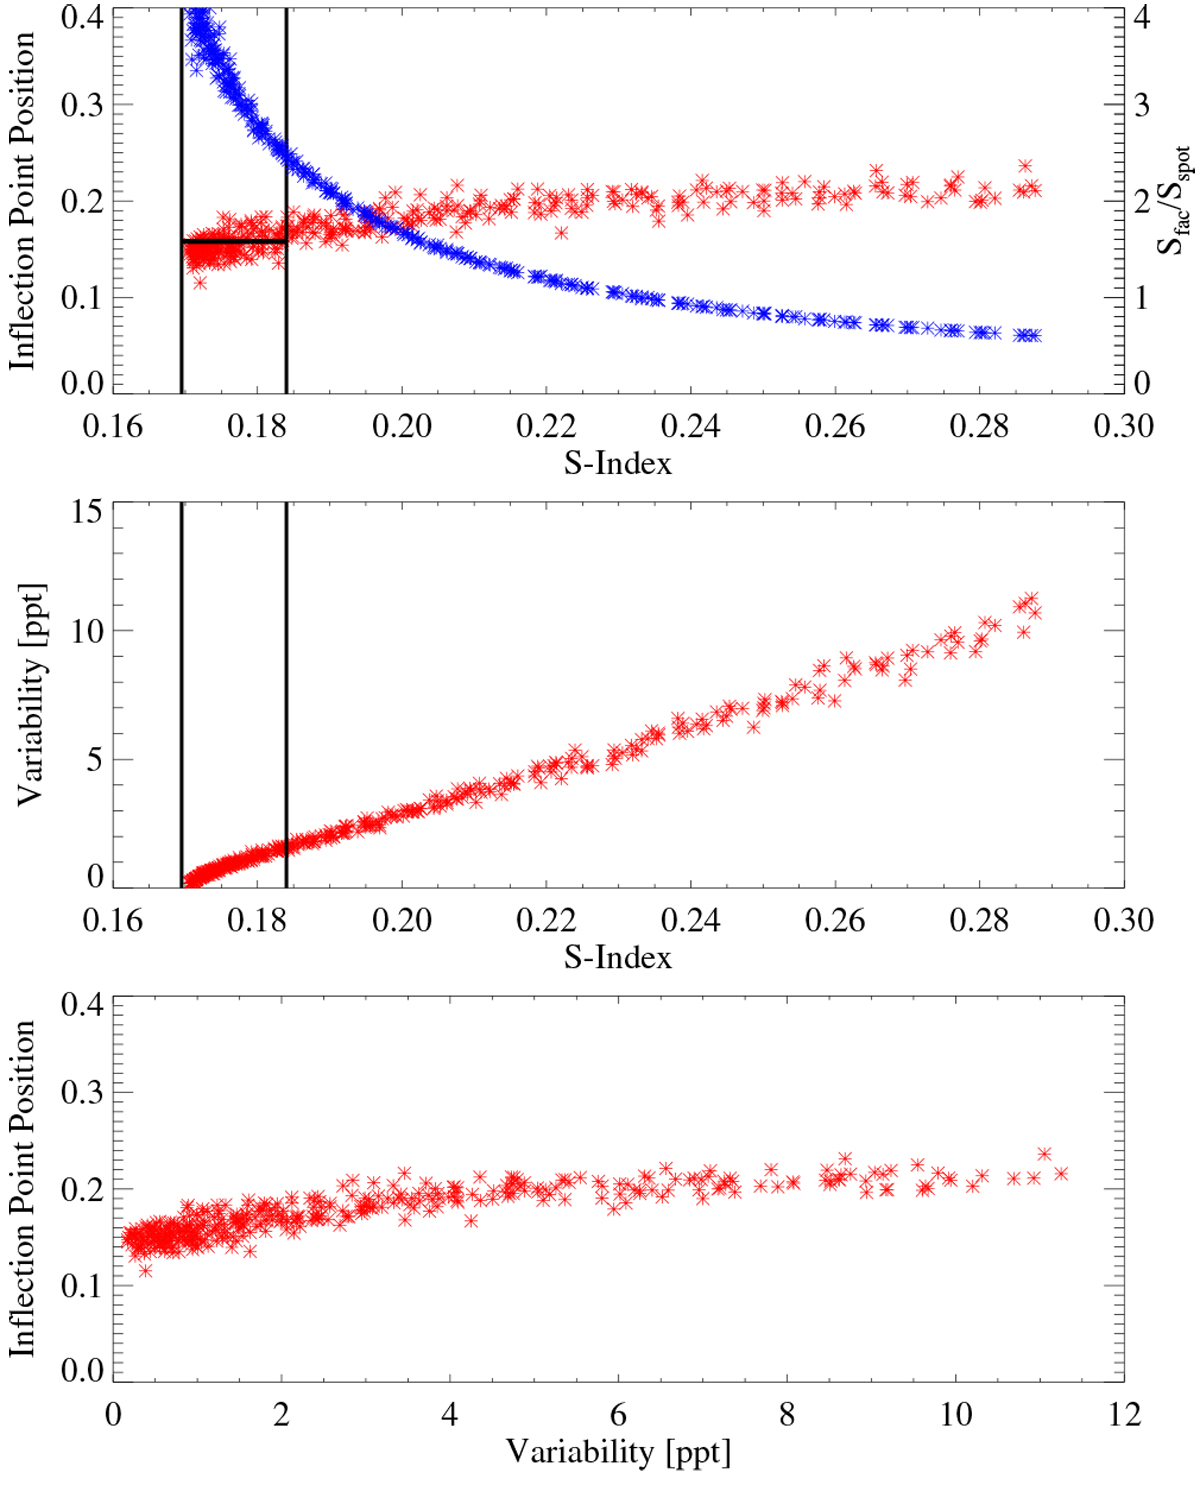
Dependence of inflection point position (given as fraction of rotation period, Prot =30 d) on S-index and stellar photometric variability (shown in red in top and bottom panels, respectively) as well as dependence of photometric variability on S-index (middle panel). Blue asterisks in upper panel indicate the dependence of the facular to spot ratio at the time of maximum area, Sfac ∕Sspot, on the S-index. Black vertical lines in upper and middle panels point to the range of solar S-index values, while the horizontal black line in the top panel corresponds to the position of solar inflection point from Amazo-Gomez et al. (2019).
Current usage metrics show cumulative count of Article Views (full-text article views including HTML views, PDF and ePub downloads, according to the available data) and Abstracts Views on Vision4Press platform.
Data correspond to usage on the plateform after 2015. The current usage metrics is available 48-96 hours after online publication and is updated daily on week days.
Initial download of the metrics may take a while.