Fig. 1
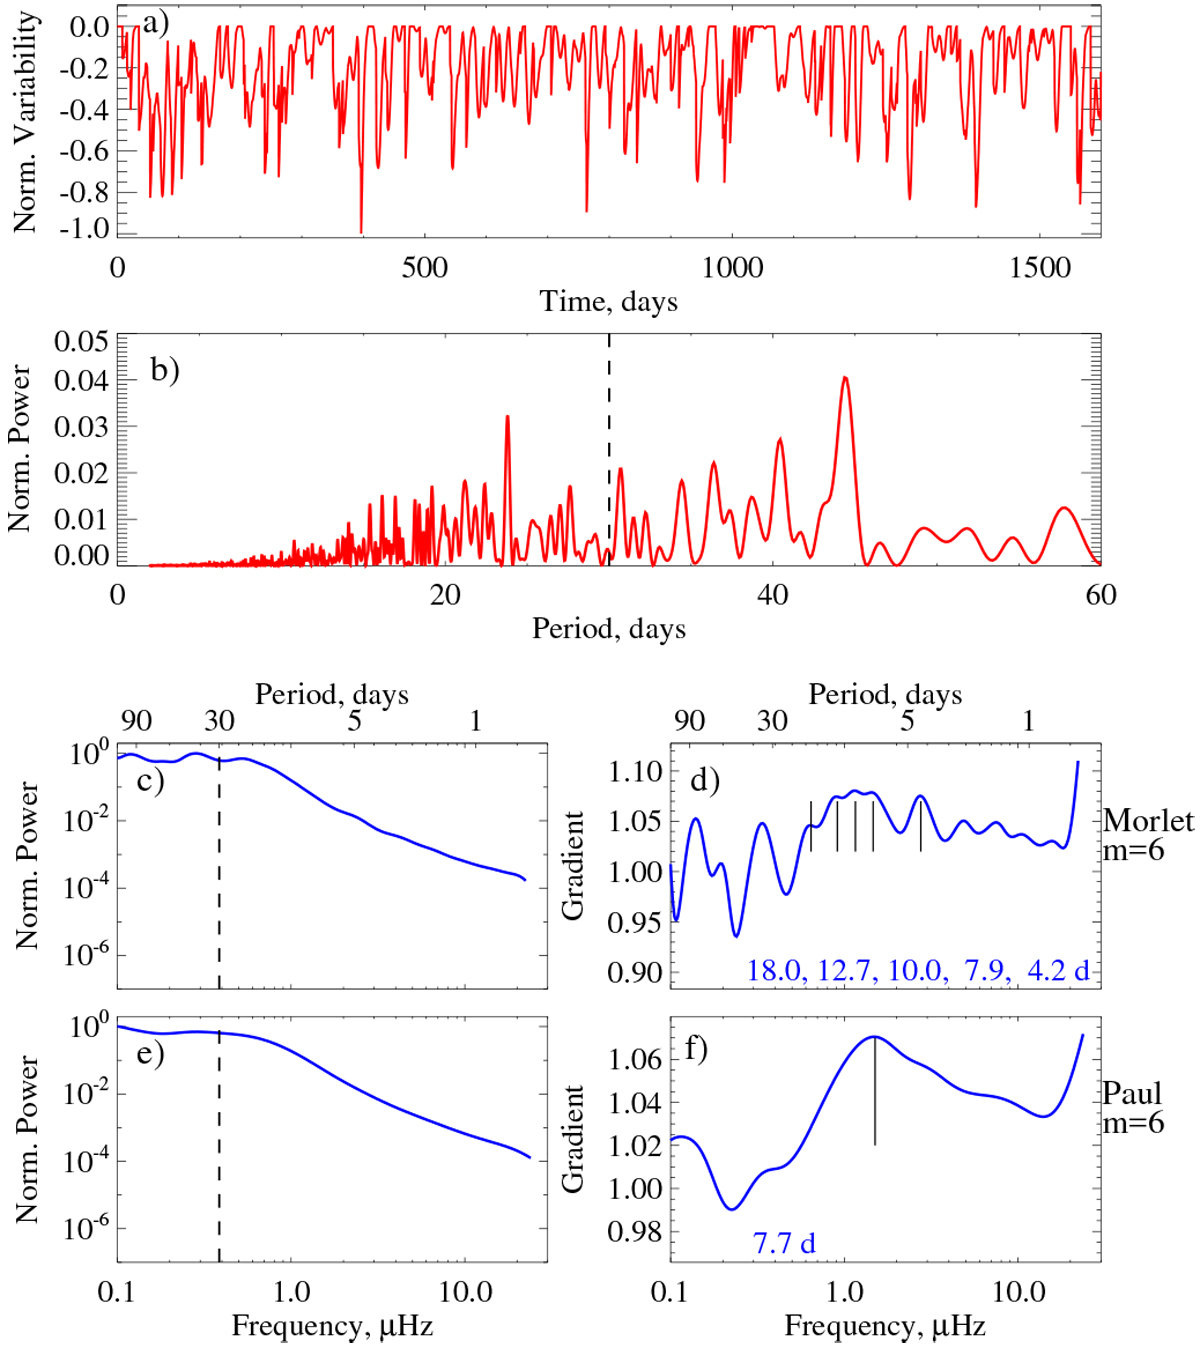
Model light curve of star with 30-day rotation period covered by spots and observed from its equatorial plane. The spots decay according to a linear law with Tspot =25 d. Two upper panels: normalized light curve (panel a) and corresponding Lomb–Scargle periodogram (panel b). Panels c–f: global wavelet power spectra (left panels) and corresponding gradient of the power spectra (right panels) calculated with the 6th order Morlet wavelet (panels c and d) and with the sixth-order Paul wavelet (panels e and f). The values of the gradients of these power spectra are a scaled and offset by unity (see Eq. (3) and the discussion in the text for the exact quantity plotted). Numbers in panels d and f correspond to the positions of the inflection points (i.e., local maxima of the gradient). Vertical dashed lines in panels b, c, and e indicate the rotation period of the modeled star. Vertical solid lines in panels d and f indicate the positions of the inflection points. We note that since spots reduce stellar brightness, the normalized variability (i.e., normalized F(λ, t) − FQ(λ) values, see Eq. (1)) is plotted between −1 and 0.
Current usage metrics show cumulative count of Article Views (full-text article views including HTML views, PDF and ePub downloads, according to the available data) and Abstracts Views on Vision4Press platform.
Data correspond to usage on the plateform after 2015. The current usage metrics is available 48-96 hours after online publication and is updated daily on week days.
Initial download of the metrics may take a while.