Fig. 5.
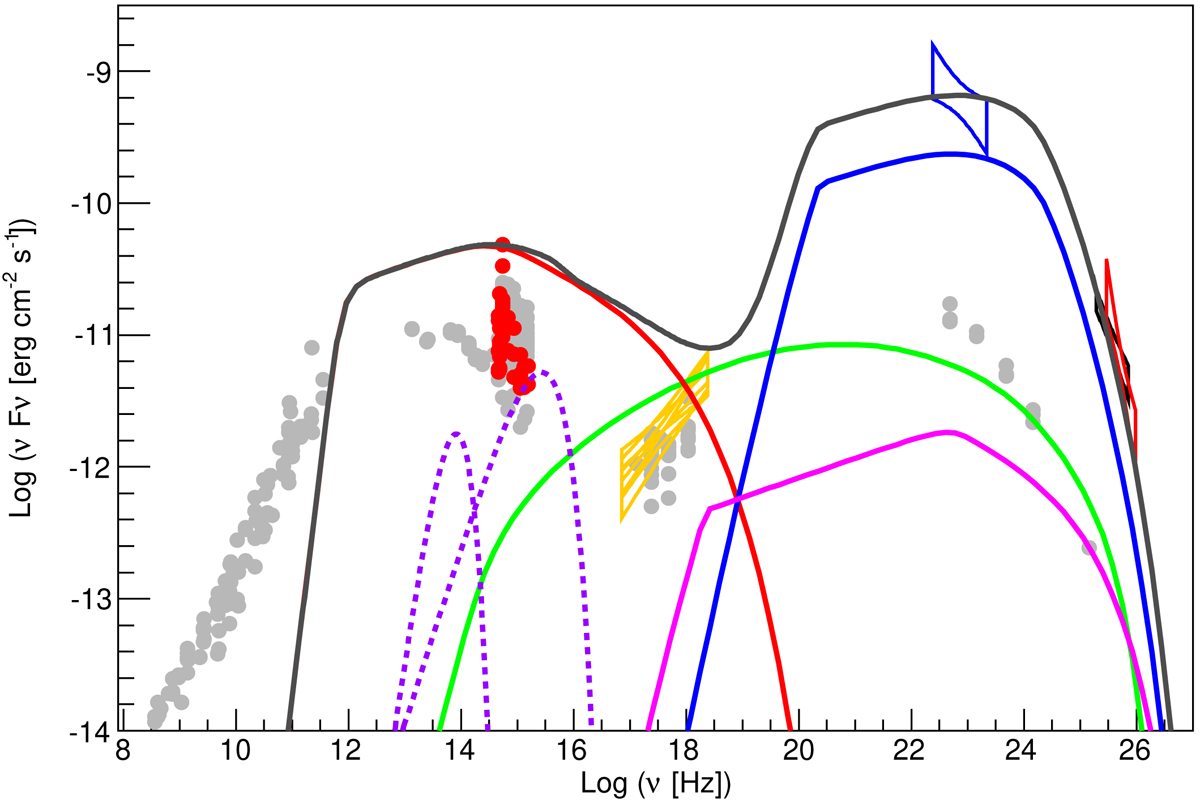
Spectral energy distribution of PKS 0736+017 during the multi-wavelength campaign of February 2015, together with archival data (in gray). The black and red bowties represent the H.E.S.S. spectra during the night of February 19, 2015, for the monoscopic and stereoscopic reconstruction, respectively; the blue bowtie represents the Fermi-LAT spectrum simultaneous with the H.E.S.S. detection; the orange bowties represents the four Swift-XRT spectra, acquired after the H.E.S.S. detection; the red points represent all optical-UV measurements before and after the flare, from ATOM, Steward Observatory, and Swift-UVOT. Shown are the EIC model components, from low to high energies: synchrotron emission by leptons (in red), synchrotron self-Compton emission (in green), EIC emission over Lyα line (in blue, emission from EIC over other BLR lines is not plotted for the sake of clarity), EIC emission over the dust torus (in magenta). The violet dotted lines represent the thermal emission from the dusty torus and the accretion disk.
Current usage metrics show cumulative count of Article Views (full-text article views including HTML views, PDF and ePub downloads, according to the available data) and Abstracts Views on Vision4Press platform.
Data correspond to usage on the plateform after 2015. The current usage metrics is available 48-96 hours after online publication and is updated daily on week days.
Initial download of the metrics may take a while.