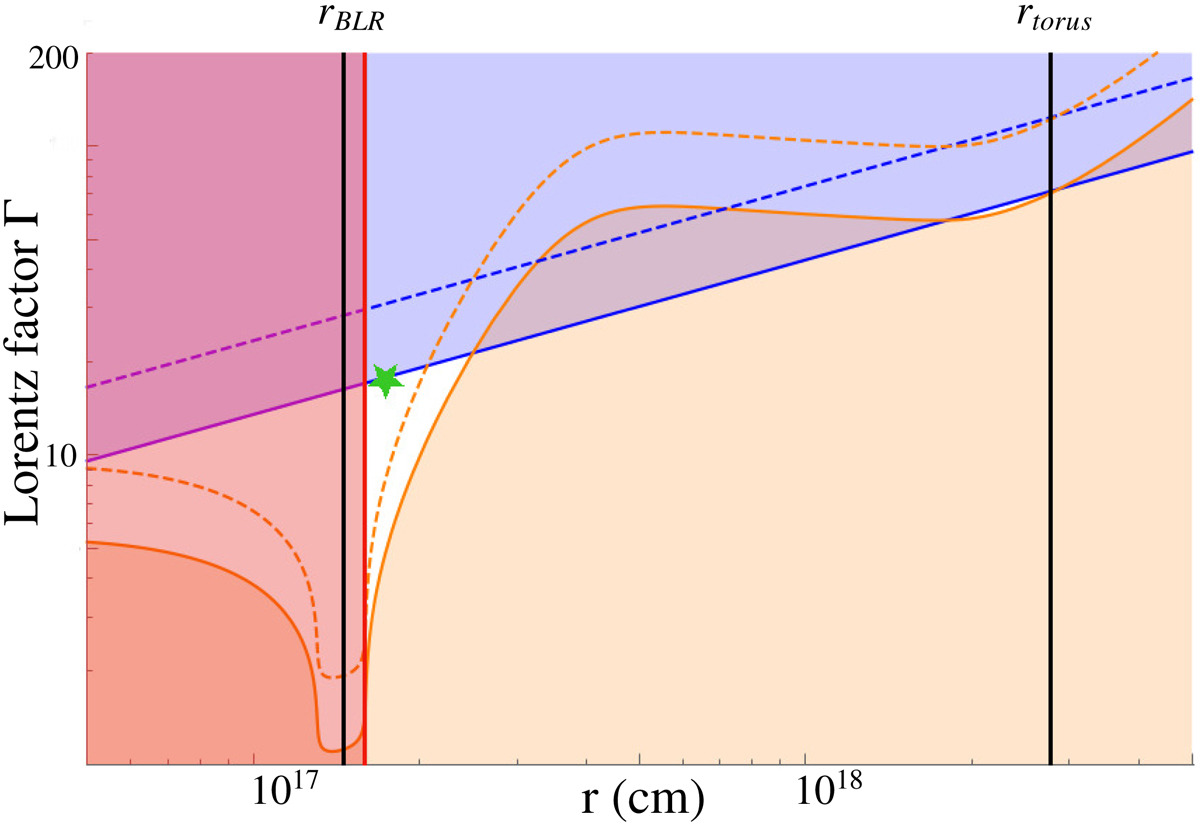
Fig. 4.
Constraint on the location of the emitting region r in centimeters, defined as the distance from the SMBH, as a function of the bulk Lorentz factor Γ. The red exclusion region represents the opacity constraint, the blue exclusion region represents the collimation constraint, and the orange exclusion region represents the cooling constraint, the last two computed for τvar = 6 h. Dashed lines show how the constraints change assuming τvar = 2 h. The white regions indicate the allowed part of the parameter space. The vertical black lines represents the estimated locations of the BLR rBLR and of the dust torus rtorus. The green star identifies the parameters of the EIC solution discussed in Sect. 3.2 and plotted in Fig. 5.
Current usage metrics show cumulative count of Article Views (full-text article views including HTML views, PDF and ePub downloads, according to the available data) and Abstracts Views on Vision4Press platform.
Data correspond to usage on the plateform after 2015. The current usage metrics is available 48-96 hours after online publication and is updated daily on week days.
Initial download of the metrics may take a while.