Fig. 1.
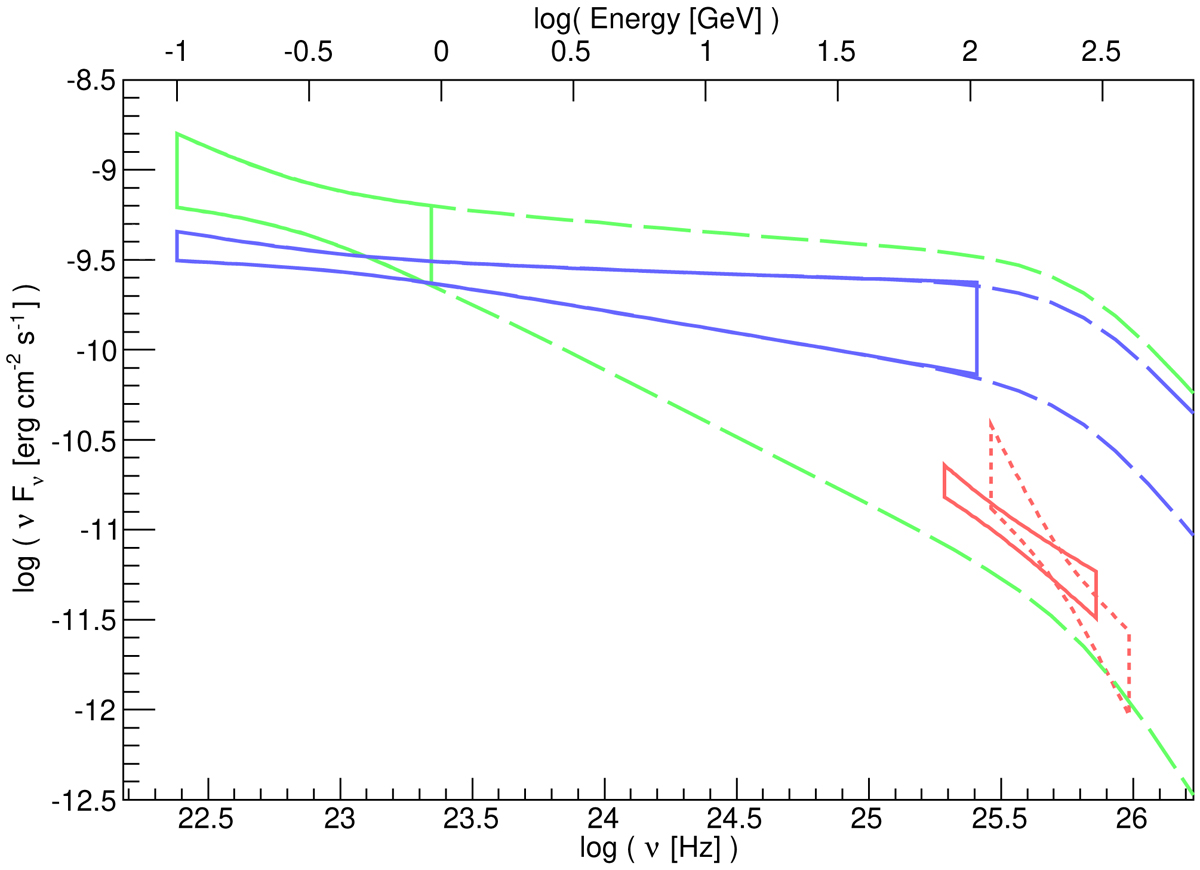
γ-ray emission from PKS 0736+017 centered on the night of February 19, 2015. The red bowtie represents the spectrum measured with H.E.S.S. using the monoscopic (bold line) and the stereoscopic analysis (dashed line). The green and blue bowties represent the spectra measured with Fermi-LAT strictly simultaneous with the H.E.S.S. detection, and integrating over an exposure of 24 h (MJD 57072.5−57073.5) around the H.E.S.S. detection, respectively; the extrapolation of Fermi-LAT spectra to higher energies (green and blue long-dashed lines) takes into account the absorption on the EBL (Franceschini et al. 2008).
Current usage metrics show cumulative count of Article Views (full-text article views including HTML views, PDF and ePub downloads, according to the available data) and Abstracts Views on Vision4Press platform.
Data correspond to usage on the plateform after 2015. The current usage metrics is available 48-96 hours after online publication and is updated daily on week days.
Initial download of the metrics may take a while.