Fig. 1
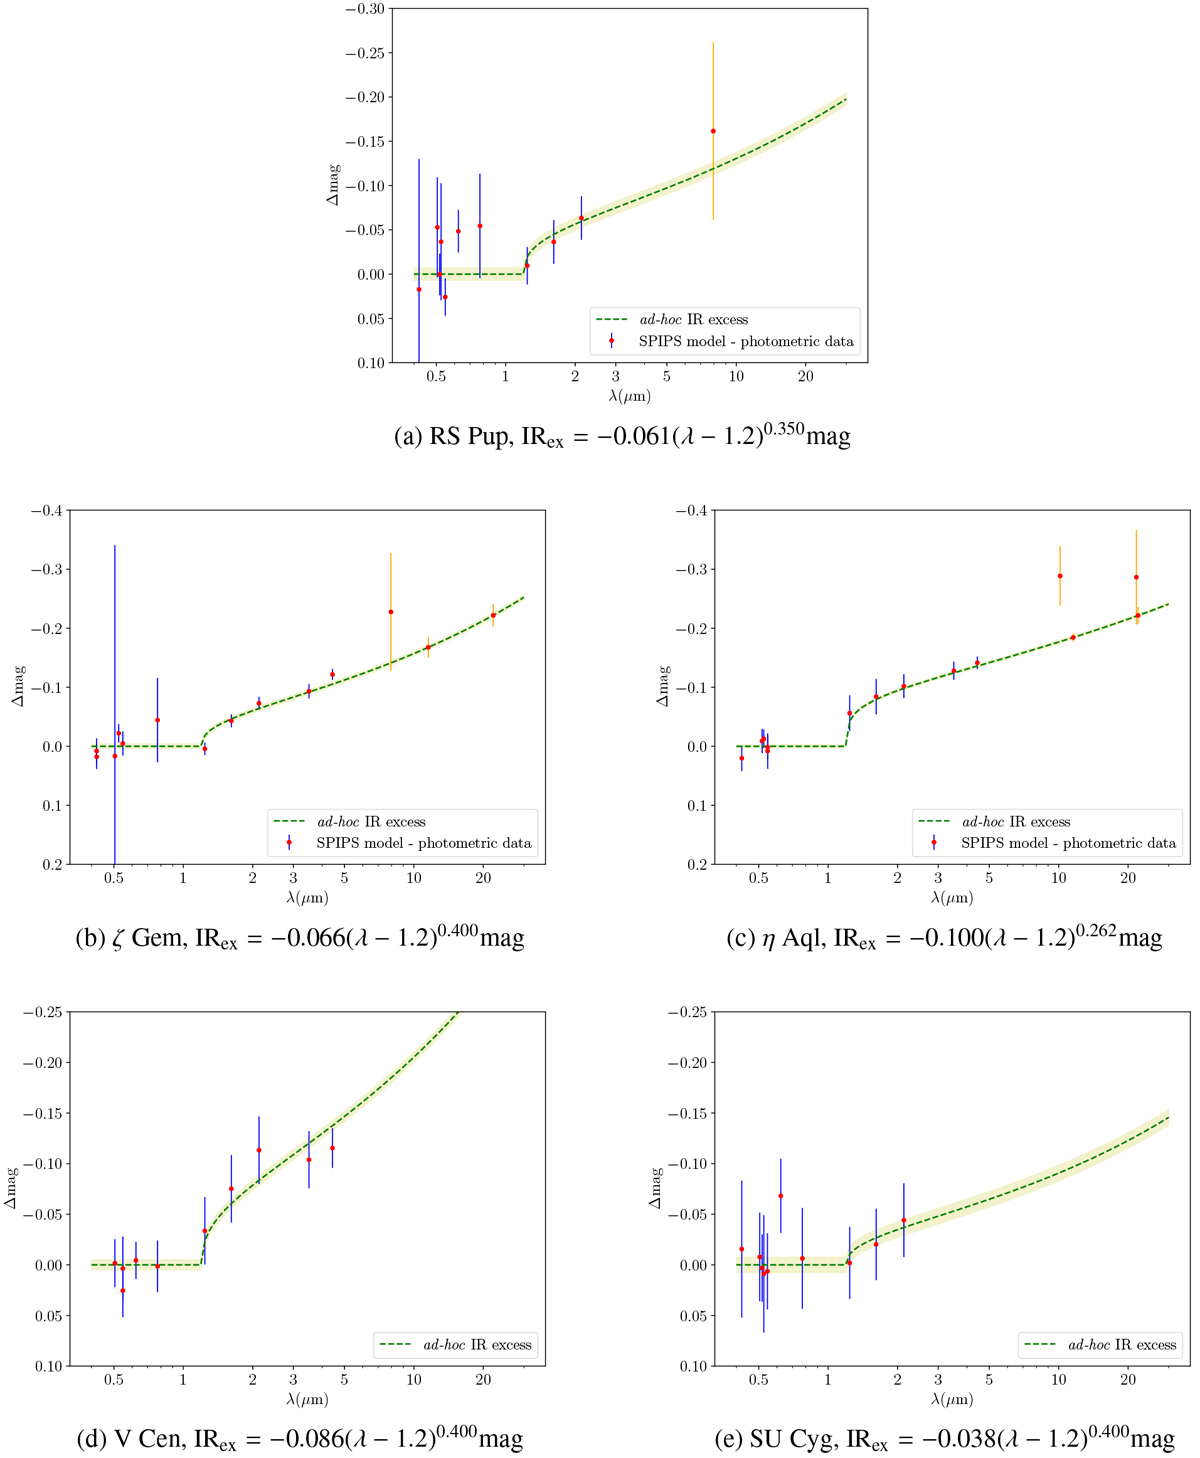
IR excess analytic law for all star sample together with measurements. IR excess as derived from the SPIPS algorithm and represented by ad hoc analytic laws (Eq. (1)) for each star in the sample. For each photometric band, red dots with error bars are the mean excess value over the cycle of the Cepheid and the corresponding standard deviation. Red point with orange bars are photometric band discarded in this work (see Sect. 2.2). The green zone is the error on the magnitude obtained using the covariance matrix of SPIPS fitting result.
Current usage metrics show cumulative count of Article Views (full-text article views including HTML views, PDF and ePub downloads, according to the available data) and Abstracts Views on Vision4Press platform.
Data correspond to usage on the plateform after 2015. The current usage metrics is available 48-96 hours after online publication and is updated daily on week days.
Initial download of the metrics may take a while.