Fig. A.1.
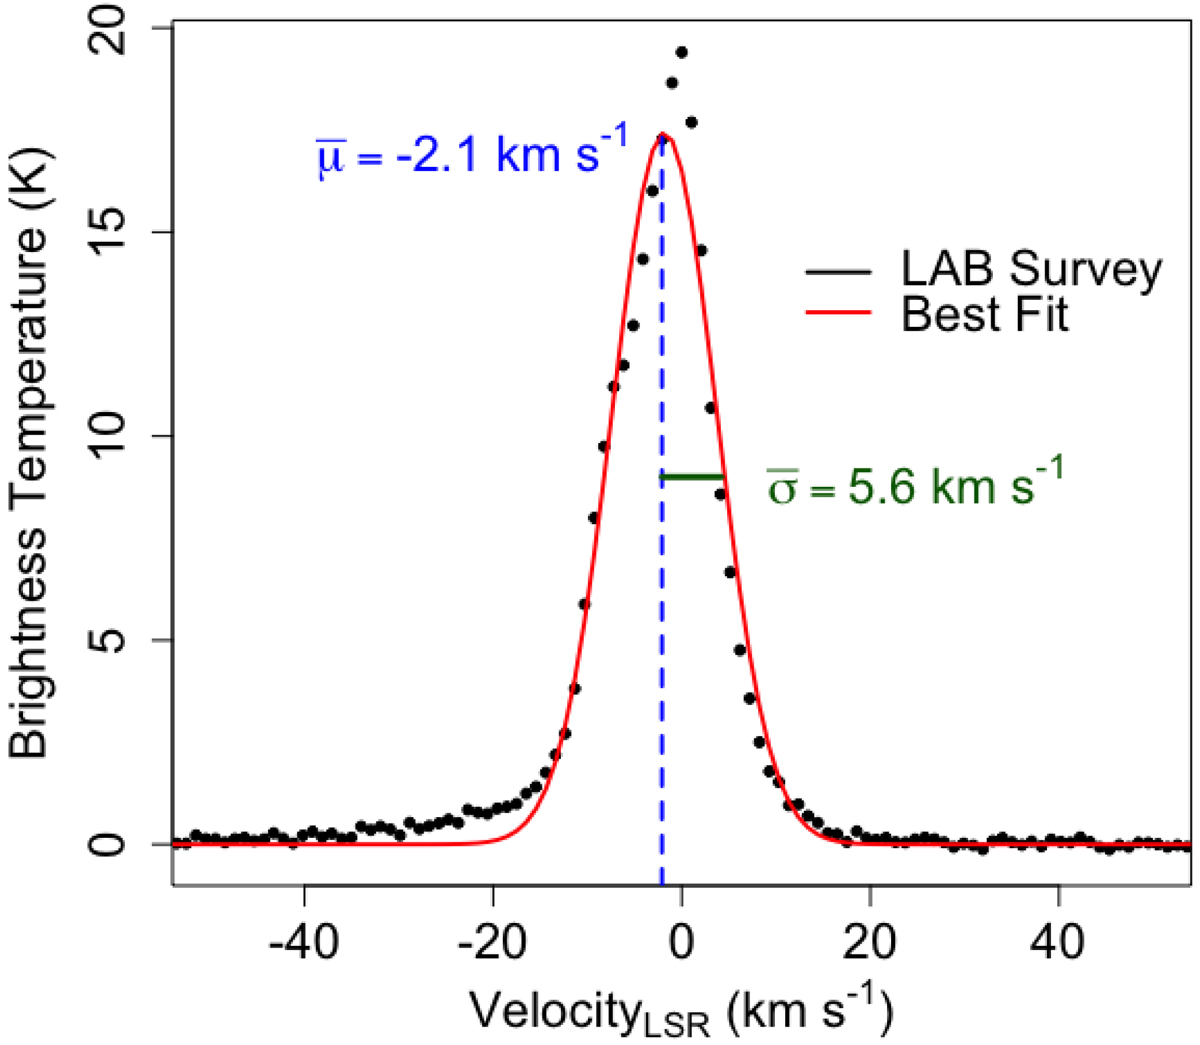
Galactic 21 cm H I profile in our line of sight towards NGC 7469, of brightness temperature as a function of velocity, from the LAB survey (black dots). The red line is the Gaussian function (Eq. (A.1)) used to determine the velocity dispersion σv and the velocity mean μ. Estimates of these two parameters were obtained by averaging the values from the LAB (Kalberla et al. 2005) and EBHIS (Winkel et al. 2016) surveys. The average velocity dispersion is used as the turbulent velocity for the Galaxy in the HOT components; see text for details of this argument.
Current usage metrics show cumulative count of Article Views (full-text article views including HTML views, PDF and ePub downloads, according to the available data) and Abstracts Views on Vision4Press platform.
Data correspond to usage on the plateform after 2015. The current usage metrics is available 48-96 hours after online publication and is updated daily on week days.
Initial download of the metrics may take a while.