Fig. 6.
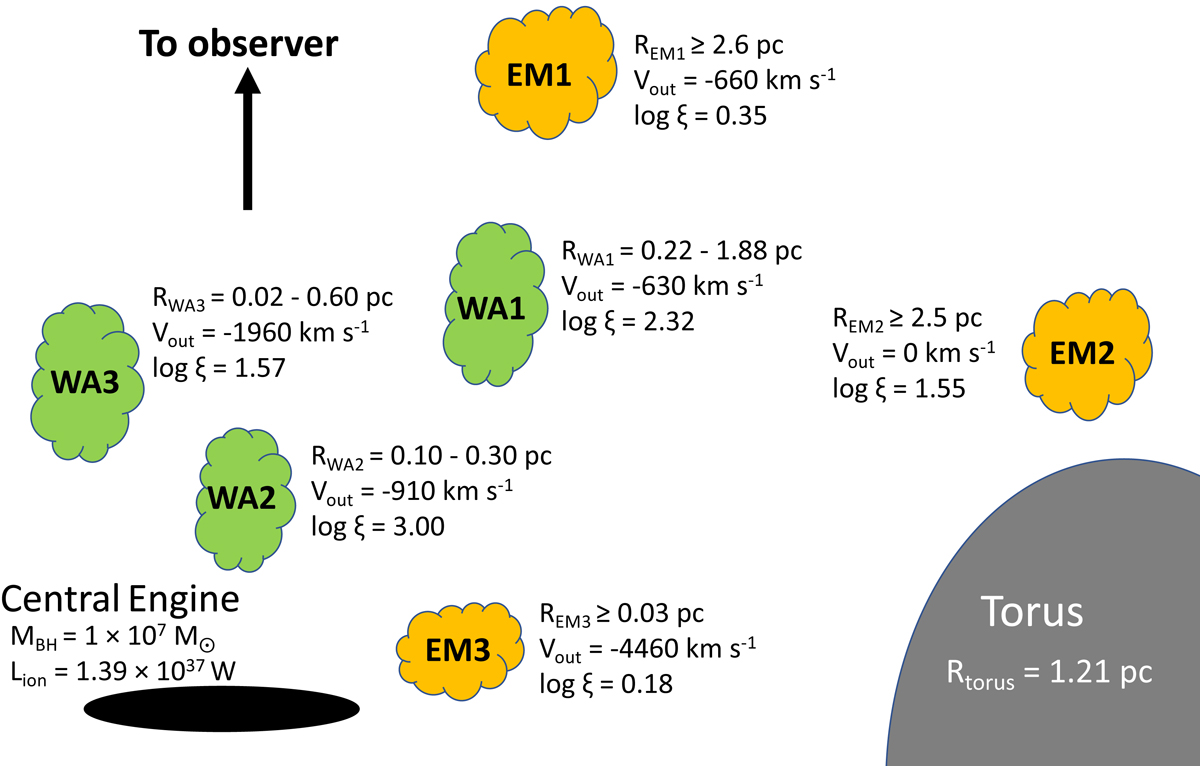
Schematic display of the possible locations of the WAs (green) and emission line regions (orange) with respect to the central black hole. This graphic is not intended to show the exact locations of the photoionised plasma clouds, but can give insight into studying the physical scenarios. Next to each plasma cloud are the distances, ionisations and outflow velocities, depicted for an easy comparison. (The distances for the emission line regions are the lower limits, as obtained from Eq. (5).) As a comparison to the X-ray broad emission component (EM3), the optical BLR is at a distance of 0.004 pc in NGC 7469 (Kollatschny & Zetzl 2013).
Current usage metrics show cumulative count of Article Views (full-text article views including HTML views, PDF and ePub downloads, according to the available data) and Abstracts Views on Vision4Press platform.
Data correspond to usage on the plateform after 2015. The current usage metrics is available 48-96 hours after online publication and is updated daily on week days.
Initial download of the metrics may take a while.