Fig. 5.
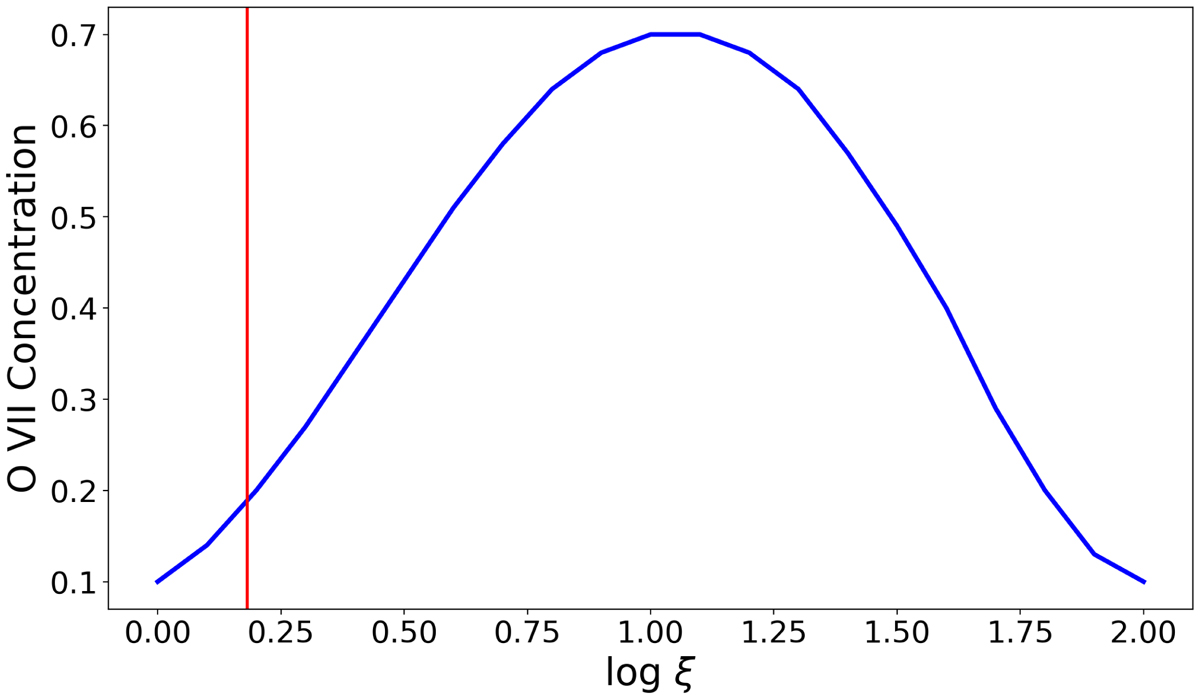
Ionic concentration of O VII as a function of ionisation parameter ξ (blue), calculated using PION. The red line shows the value of ξ found for EM3 through photoionisation modelling, which is much lower than the peak O VII ion concentration, indicating that this region is not ionised enough to produce a substantial forbidden line.
Current usage metrics show cumulative count of Article Views (full-text article views including HTML views, PDF and ePub downloads, according to the available data) and Abstracts Views on Vision4Press platform.
Data correspond to usage on the plateform after 2015. The current usage metrics is available 48-96 hours after online publication and is updated daily on week days.
Initial download of the metrics may take a while.