Fig. 3.
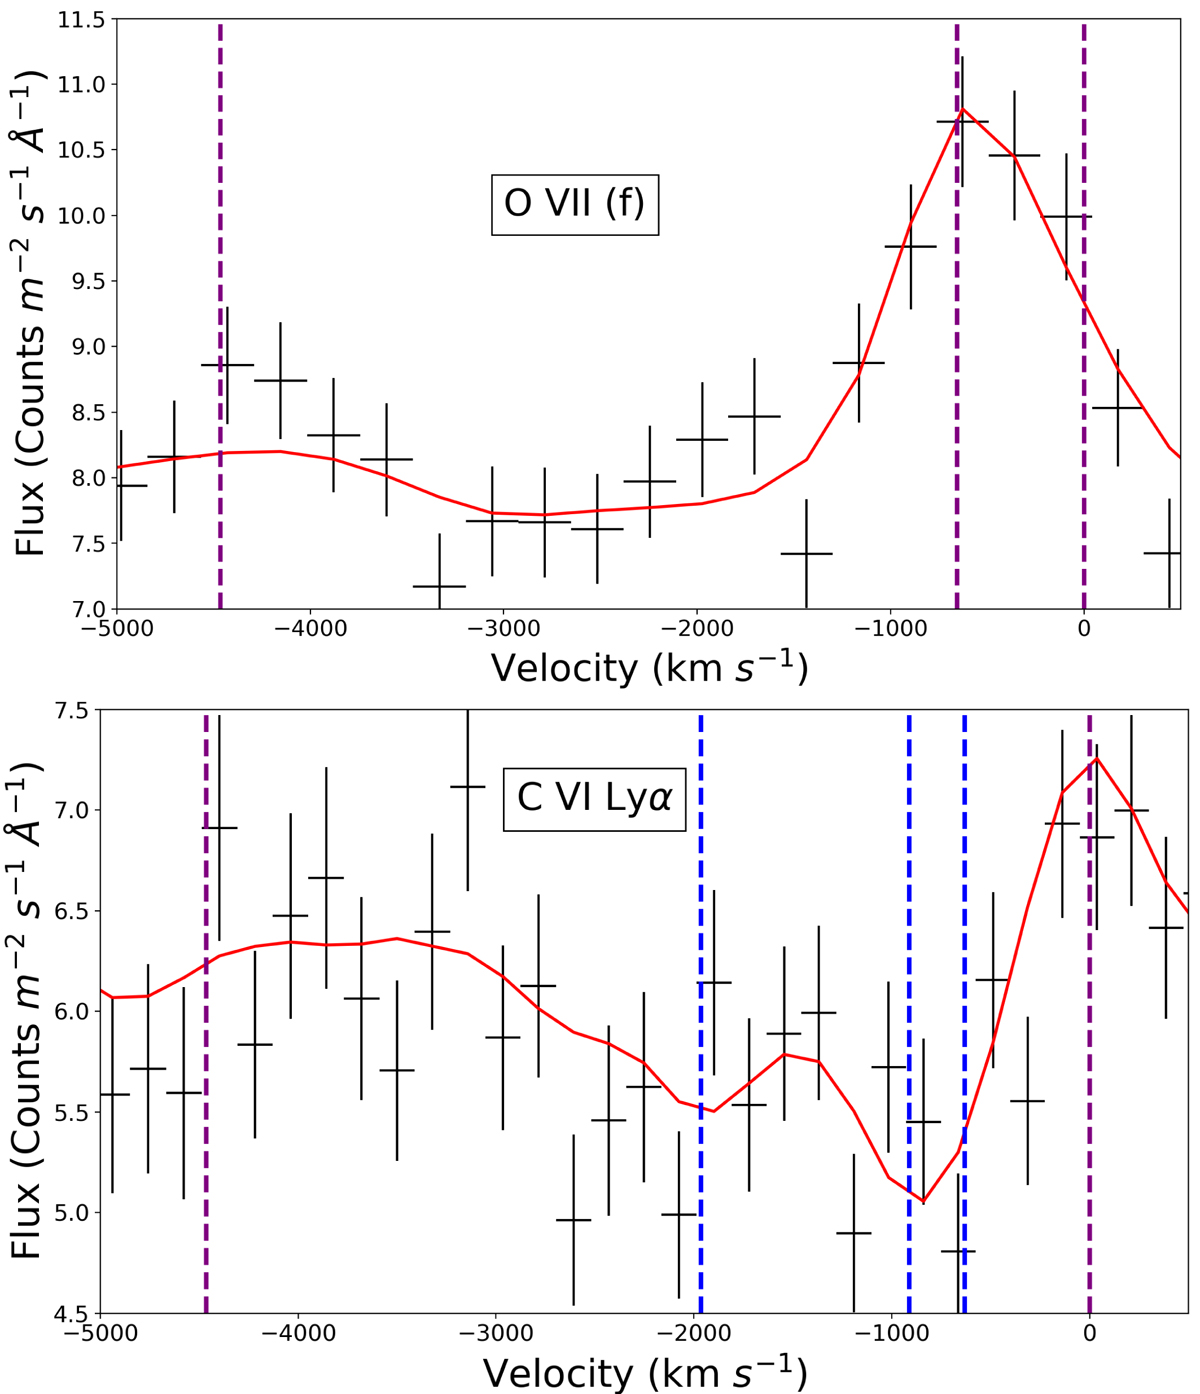
Velocity plots of the O VII (f) line (top panel) and the C VI Lyα line (bottom panel), illustrating each ion’s velocity profile. Top panel: O VII forbidden line is produced by EM1 and EM2 at −657 and 0 km s−1, respectively, as illustrated by the purple dotted lines showing the outflow velocities of the emission components. EM3 falls at the position of the intercombination line because the forbidden line is blueshifted to higher energies (vout − 4464 km s−1). Bottom panel: velocities of the three WA components (vout = −631, − 912 and − 1964 km s−1) and their contributions to the absorption (blue dotted lines). The C VI Lyα line is produced at 0 km s−1, which corresponds to EM2 (purple dotted line). We note that the widths of the emission lines in these two panels are determined fully by the resolution of the RGS instrument (FWHM ∼ 800 km s−1 at 22 Å and FWHM ∼ 600 km s−1 at 34 Å, for top and bottom panels respectively), and not by the turbulent velocities (vturb) in Table 3.
Current usage metrics show cumulative count of Article Views (full-text article views including HTML views, PDF and ePub downloads, according to the available data) and Abstracts Views on Vision4Press platform.
Data correspond to usage on the plateform after 2015. The current usage metrics is available 48-96 hours after online publication and is updated daily on week days.
Initial download of the metrics may take a while.