Fig. 2.
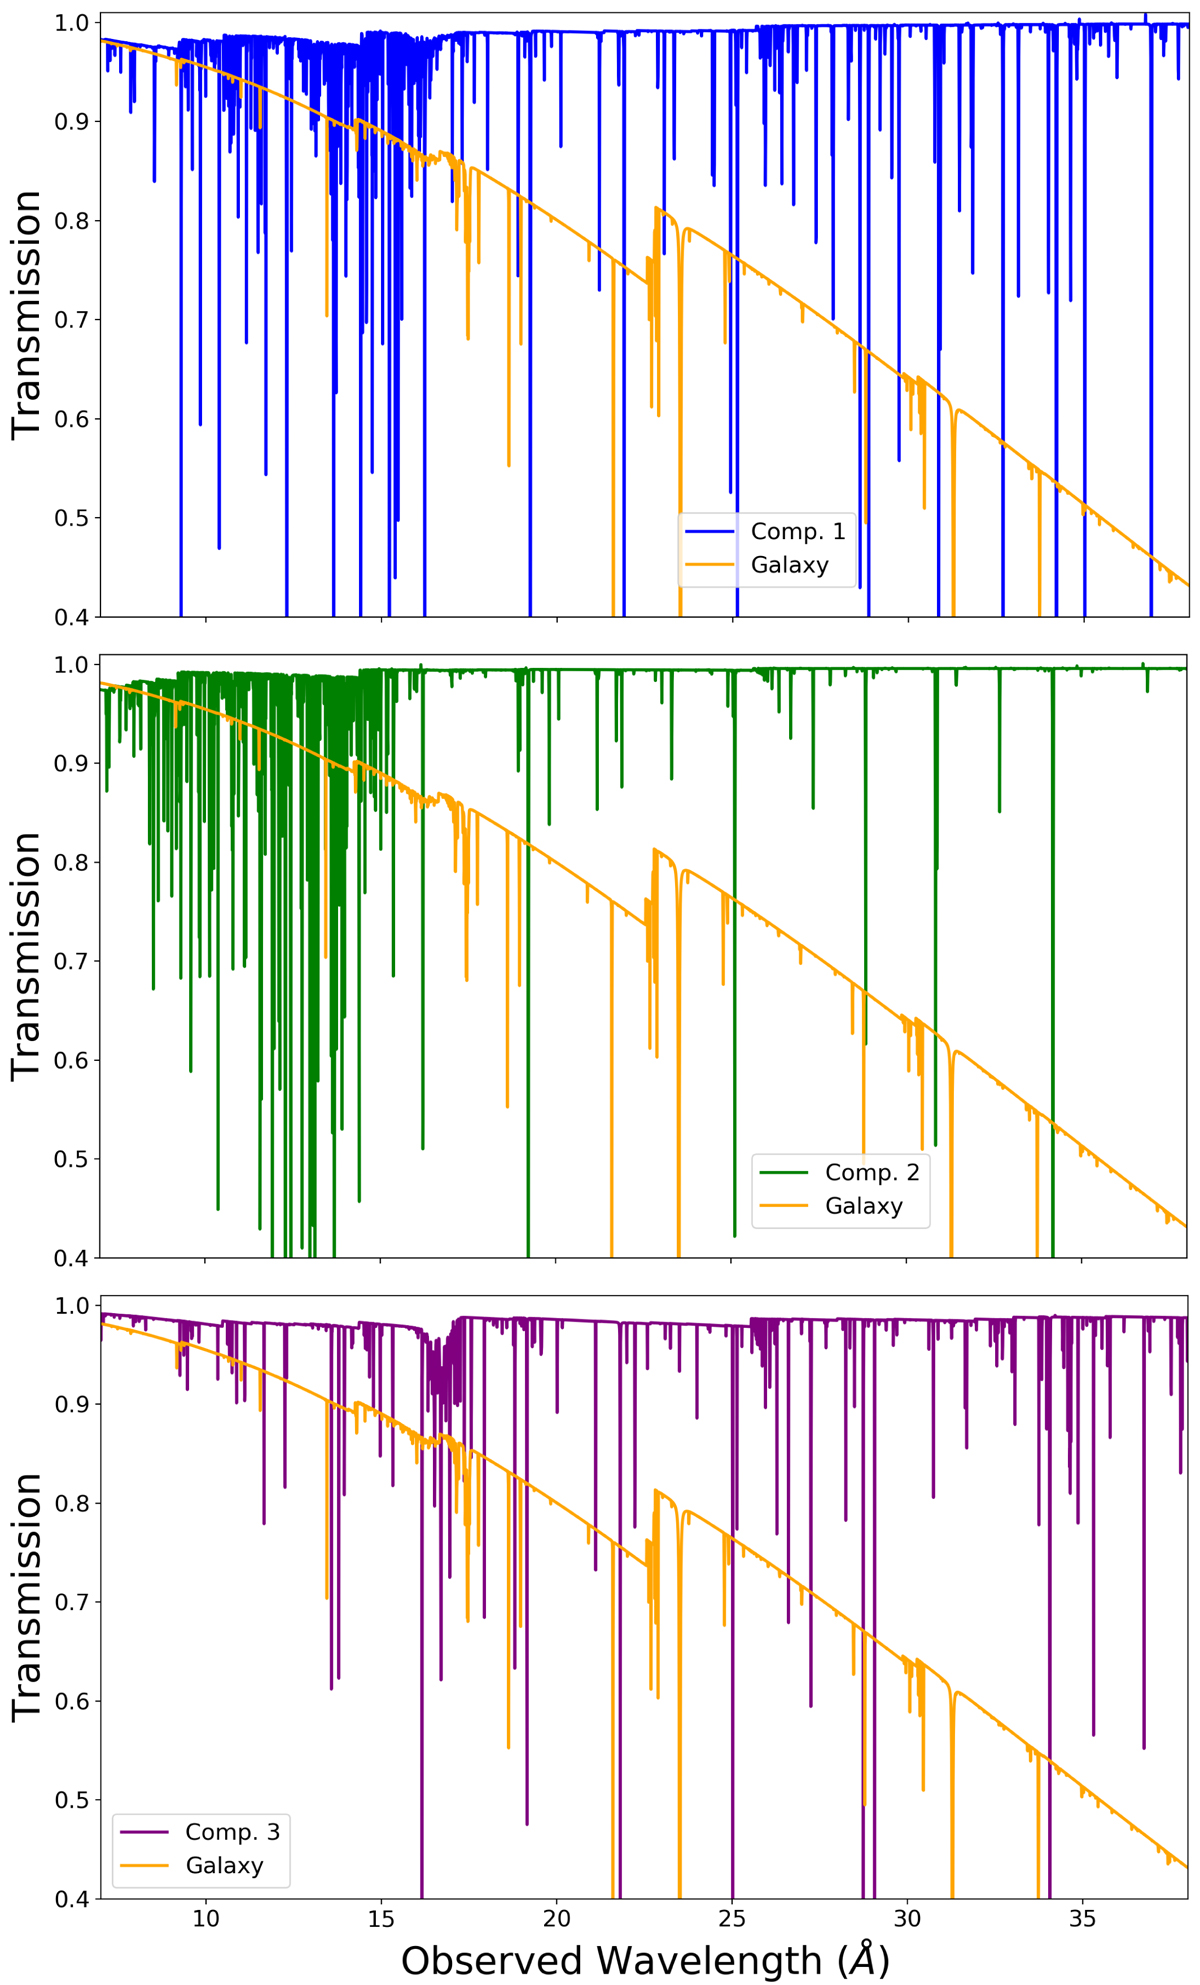
PION absorption models for each warm absorber component (1–3 from top to bottom). These plots help demonstrate what the model looks like with the parameter values from Table 2: large ξ means absorption at higher energies; large NH means stronger absorption lines. The Galaxy absorption transmission is overlayed in orange for a comparison. The Galaxy absorption affects the continuum emission, especially at longer wavelengths, causing the transmission to decrease. As a consequence of the RGS resolution, weak narrow lines are not evident in Fig. 1 due to the low equivalent width, but can be seen in these models.
Current usage metrics show cumulative count of Article Views (full-text article views including HTML views, PDF and ePub downloads, according to the available data) and Abstracts Views on Vision4Press platform.
Data correspond to usage on the plateform after 2015. The current usage metrics is available 48-96 hours after online publication and is updated daily on week days.
Initial download of the metrics may take a while.