Free Access
Fig. 1.
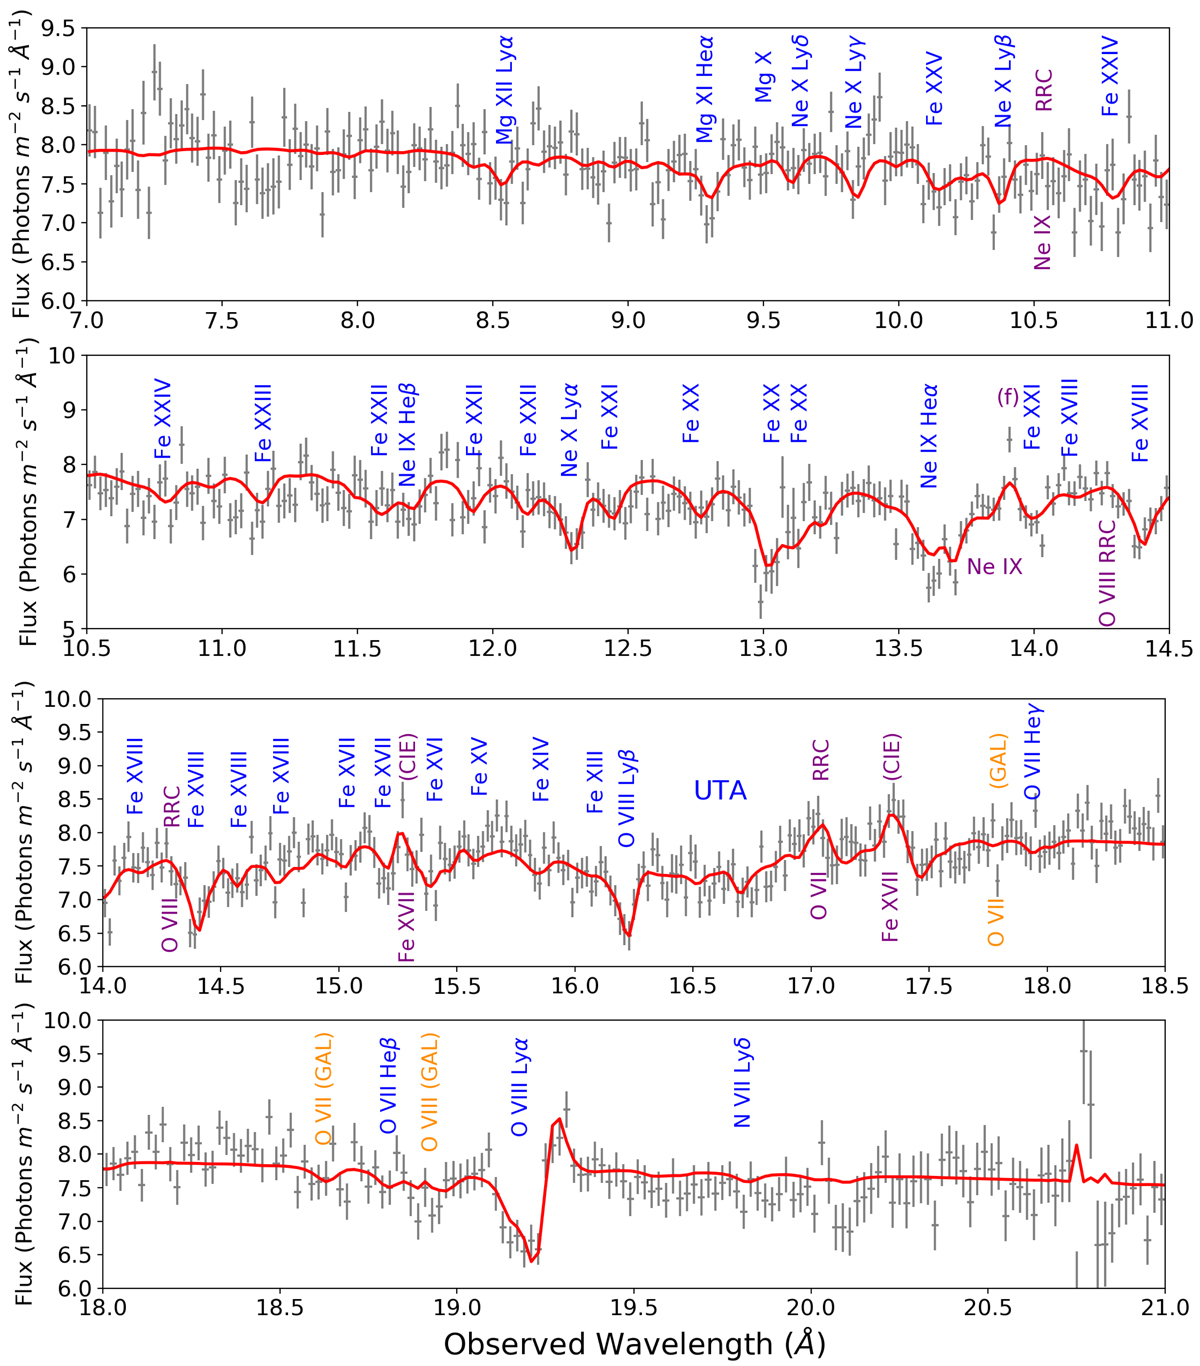
RGS spectrum of NGC 7469 in the observed frame. The best fit model (red line) is over plotted. The significant absorption and emission features are labelled with their corresponding ions (blue and purple, respectively). Galactic absorption features are indicated in orange.
Current usage metrics show cumulative count of Article Views (full-text article views including HTML views, PDF and ePub downloads, according to the available data) and Abstracts Views on Vision4Press platform.
Data correspond to usage on the plateform after 2015. The current usage metrics is available 48-96 hours after online publication and is updated daily on week days.
Initial download of the metrics may take a while.