Fig. 3.
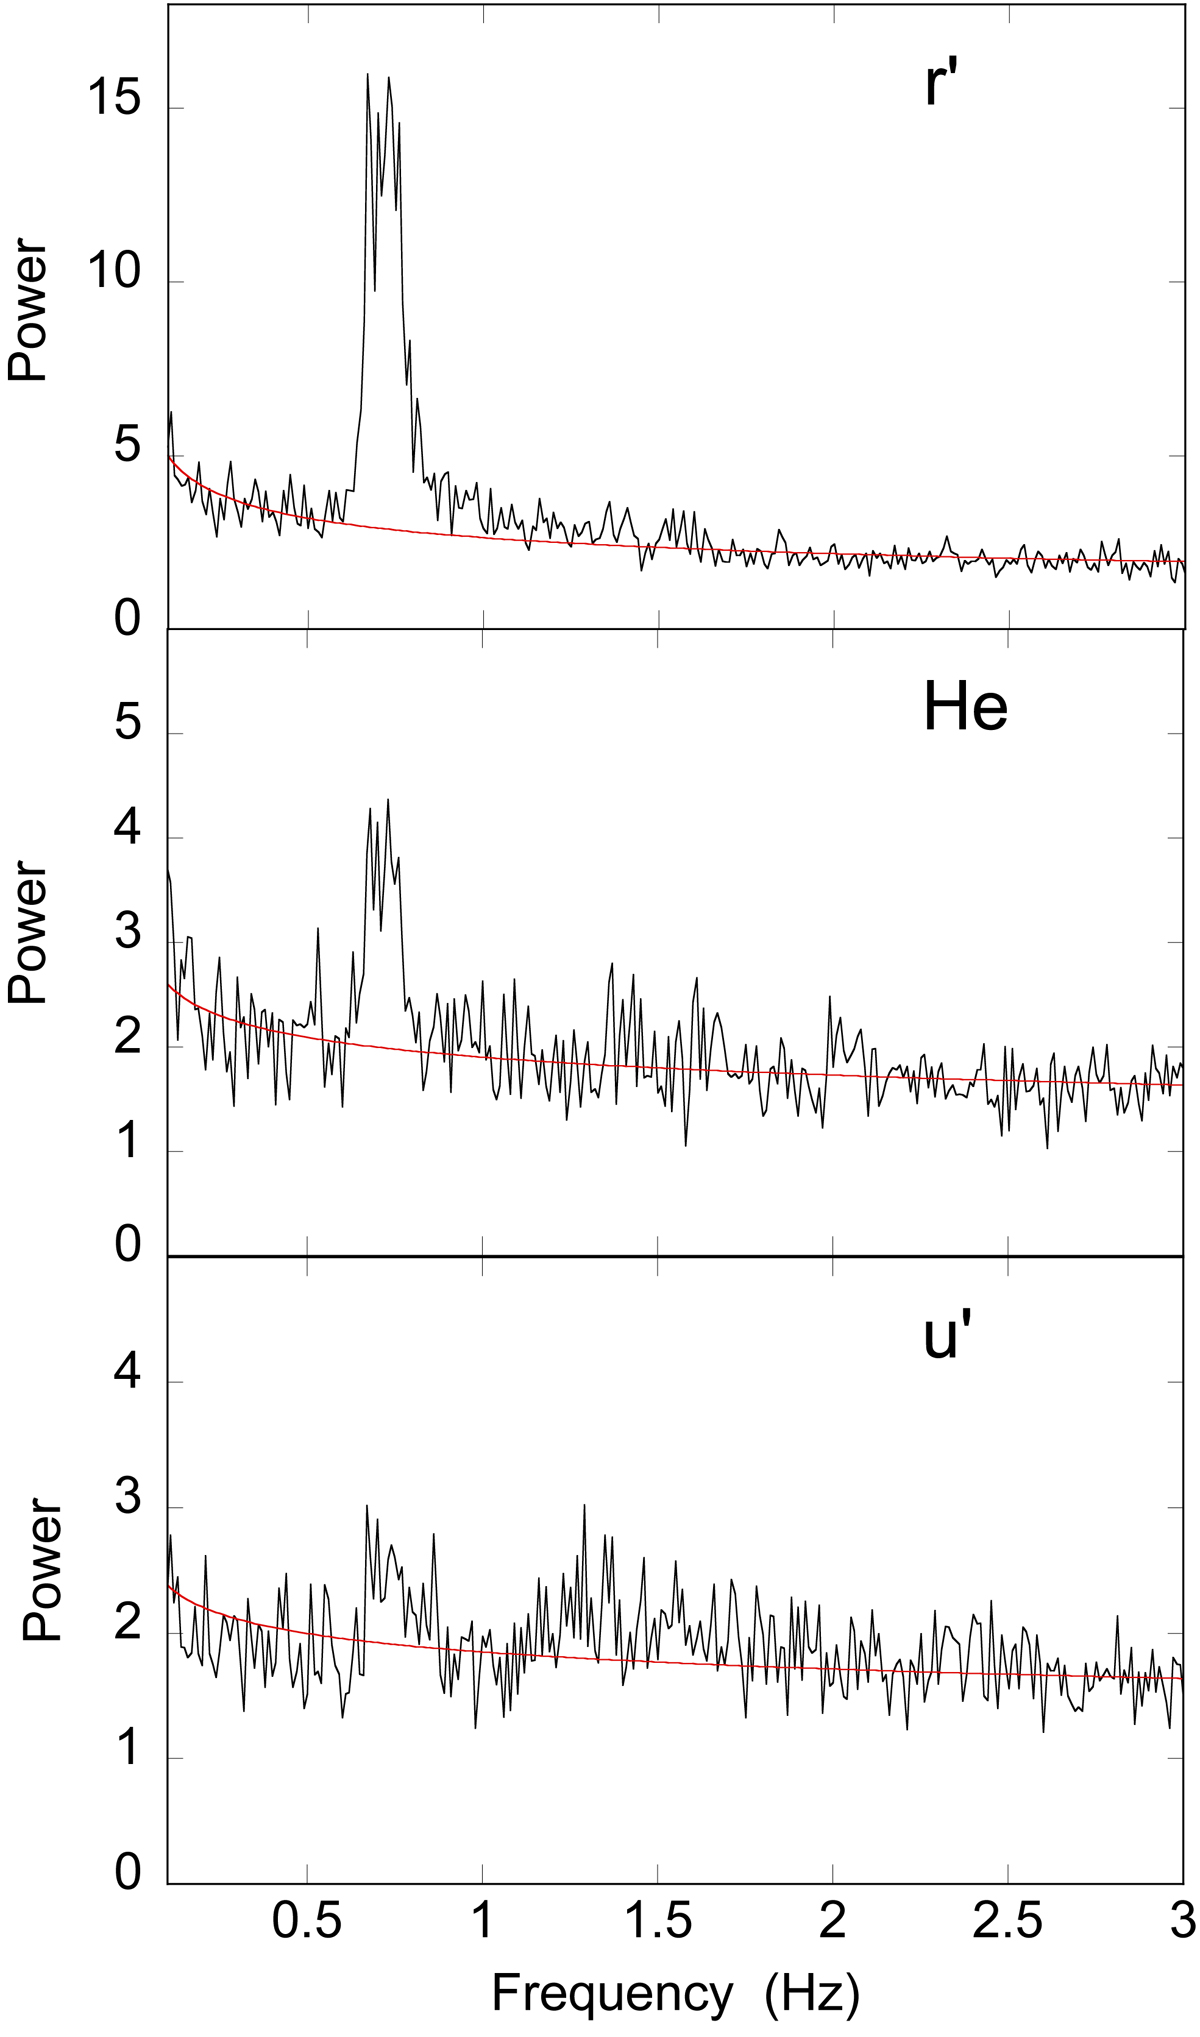
Bright phase QPO frequency profiles. Mean power density spectra are shown in the range of 0.1–3 Hz for the bright phase interval 0.75–1.15, excluding B4, in the three wavelength bands (top: r′, middle: He, bottom: u′). The Y-scale is the power computed with Leahy normalisation. The red line shows the subtracted background fitted as a power-law outside the 0.5–1 Hz interval.
Current usage metrics show cumulative count of Article Views (full-text article views including HTML views, PDF and ePub downloads, according to the available data) and Abstracts Views on Vision4Press platform.
Data correspond to usage on the plateform after 2015. The current usage metrics is available 48-96 hours after online publication and is updated daily on week days.
Initial download of the metrics may take a while.