Fig. 2.
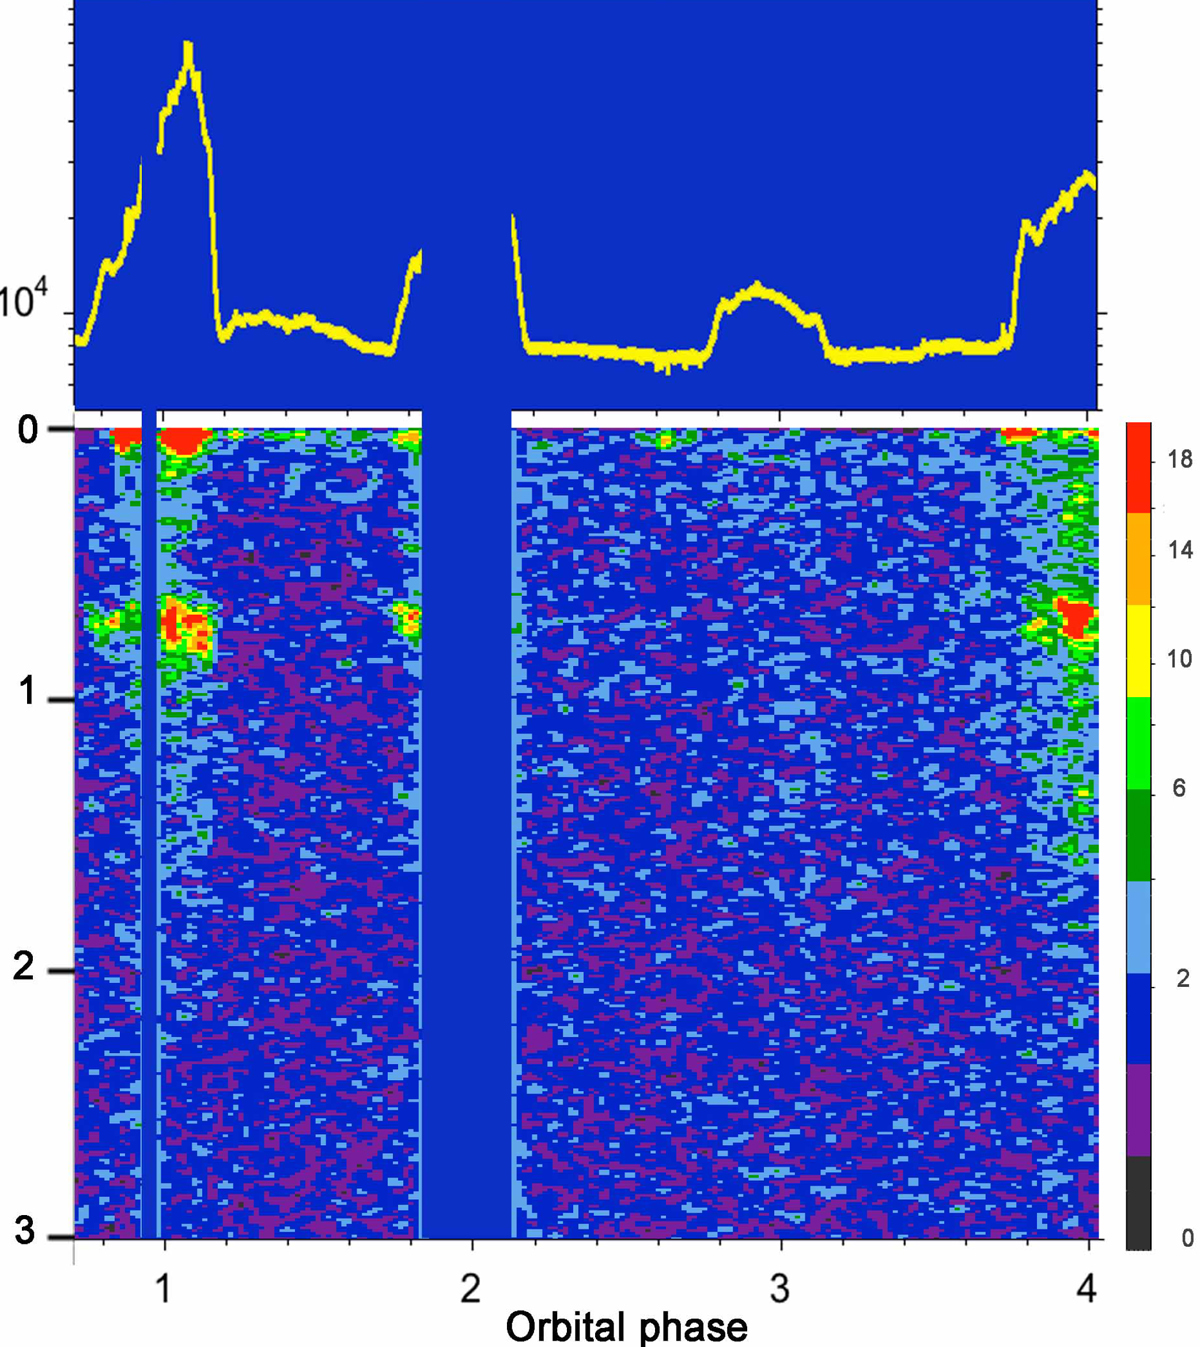
2D Time-frequency image of the power spectrum for the r′ light curve. The X-axis is the orbital phase and the Y-axis is the frequency in the restricted range 0–3 Hz. Colour-coded squared amplitude (with Leahy et al. 1983 normalisation) is shown according to the scale on the right. Individual (99.87 s) spectra are shown and the image has been smoothed with a 2-point Gauss filter. The corresponding r′ light curve is shown at the top.
Current usage metrics show cumulative count of Article Views (full-text article views including HTML views, PDF and ePub downloads, according to the available data) and Abstracts Views on Vision4Press platform.
Data correspond to usage on the plateform after 2015. The current usage metrics is available 48-96 hours after online publication and is updated daily on week days.
Initial download of the metrics may take a while.