Fig. 1.
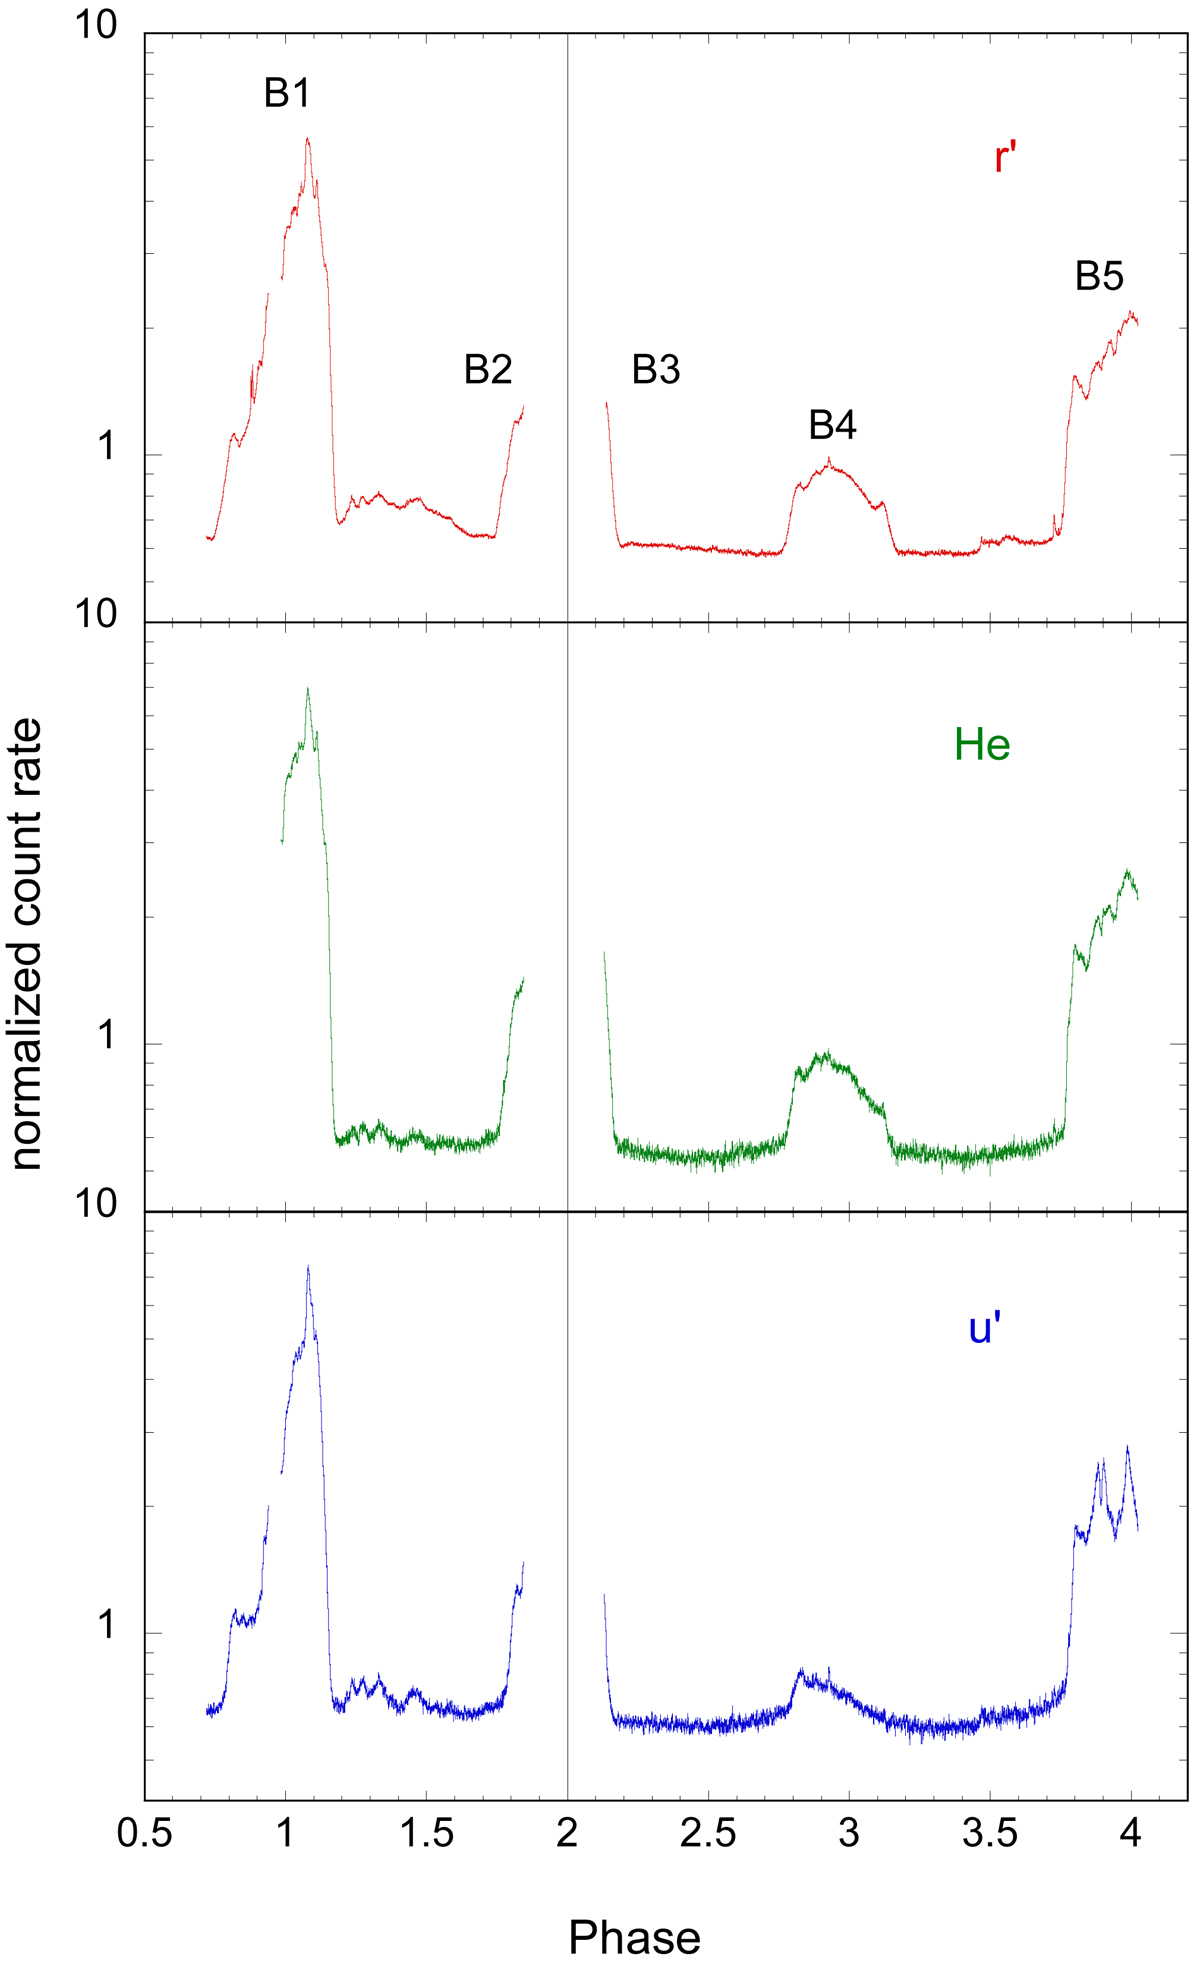
Normalised light curves in the r′ (top), He (middle) and u′ (bottom) filters versus orbital phase at a resolution of 9.7 s. The source light curve has been divided by the comparison one. Note that the vertical scale is logarithmic. The observations are spread over four different orbital cycles but split over two different nights (the vertical line indicates the gap of 27 orbital cycles). The different bright phase intervals (B1 to B5) are labelled.
Current usage metrics show cumulative count of Article Views (full-text article views including HTML views, PDF and ePub downloads, according to the available data) and Abstracts Views on Vision4Press platform.
Data correspond to usage on the plateform after 2015. The current usage metrics is available 48-96 hours after online publication and is updated daily on week days.
Initial download of the metrics may take a while.