Fig. 9
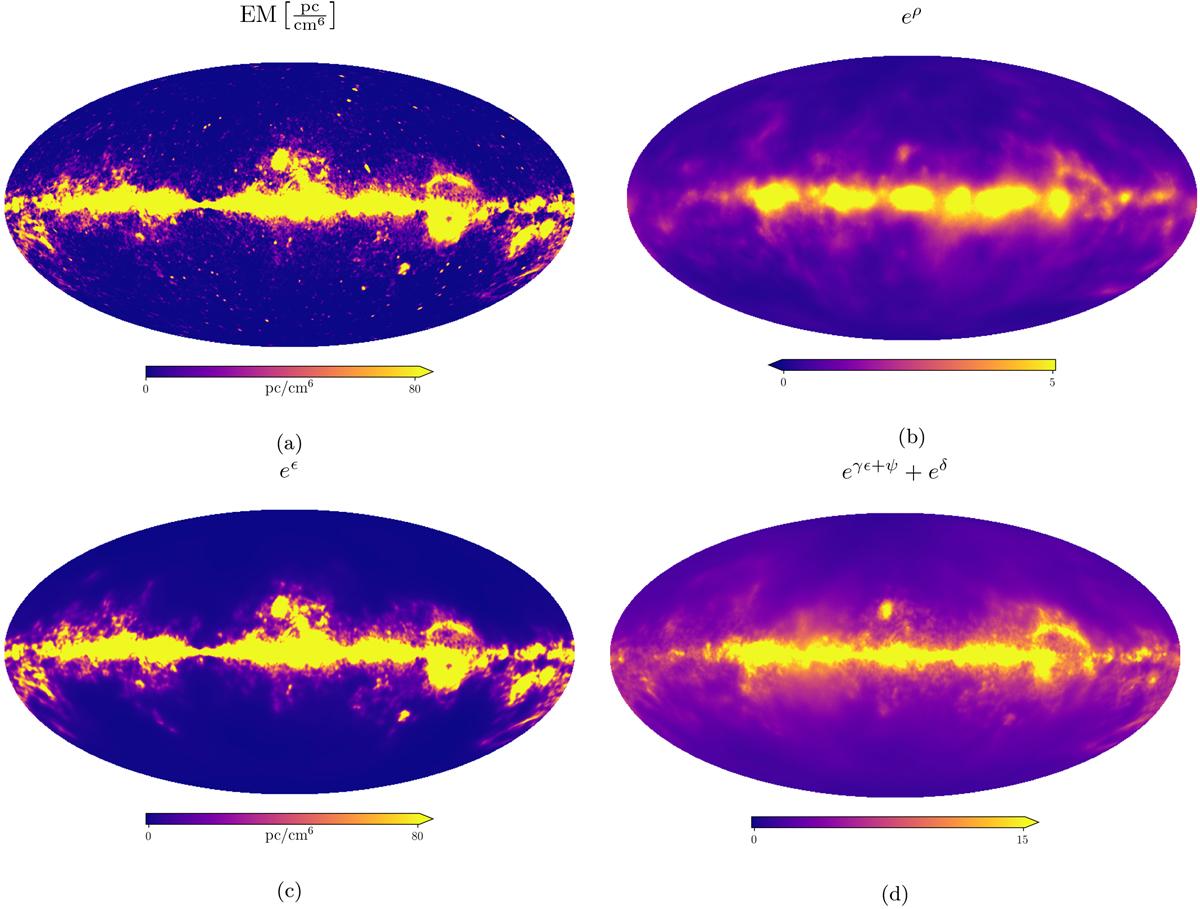
Panel a: Galactic free–free EM map obtained by the Planck Collaboration (Planck Collaboration X 2016). The other figures show the amplitude fields of the different reconstructions, which were supposed to capture the amplitude variations of the Faraday sky. Panel b: exponentiated amplitude field ρ of the reconstruction II, defined in Eq. (8). This field is not constrained by free–free data. Panel c: exponentiated ɛ field definedin Eq. (18). This field is part of the revised Faraday map resulting from reconstruction I and the denoised free–free sky. A logarithmic version of this plot is shown in Fig. 10a. Panel d: full Faraday amplitude field of reconstruction I, defined in Eq. (20). This field is part of the result of the model in Eq. (20). A logarithmic version of this plot is shown in Fig. 10d.
Current usage metrics show cumulative count of Article Views (full-text article views including HTML views, PDF and ePub downloads, according to the available data) and Abstracts Views on Vision4Press platform.
Data correspond to usage on the plateform after 2015. The current usage metrics is available 48-96 hours after online publication and is updated daily on week days.
Initial download of the metrics may take a while.