Fig. 7.
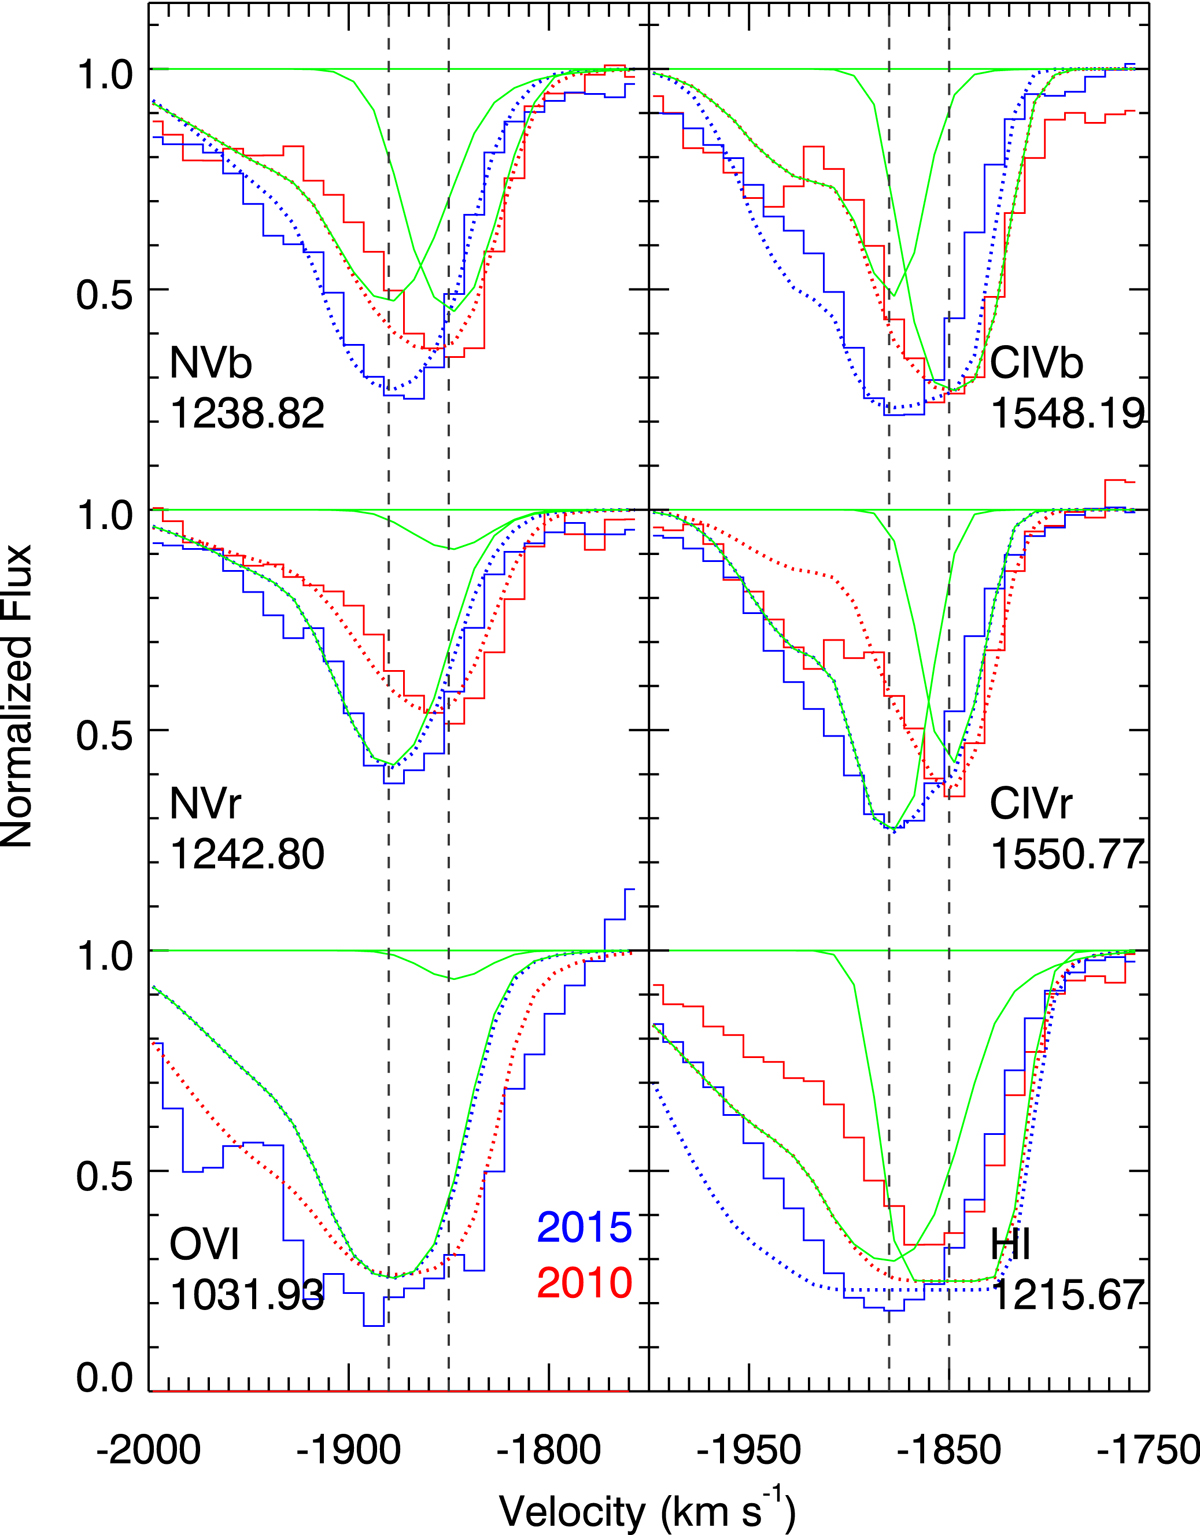
Model fit for troughs variation in component 3 (see Sect. 4.3.2). The normalized data is shown in red for the 2010 epoch and blue for the 2015 one. The full model for each trough is shown by the dotted lines of the same color. In green we show the contribution of component 3a (left curve) and 3b (right curve). For the blue doublet components (left panels) we show the contribution of the 2 phases to the 2010 model, and for the red doublet components (right panels) we show the contribution of the 2 phases to the 2015 model.
Current usage metrics show cumulative count of Article Views (full-text article views including HTML views, PDF and ePub downloads, according to the available data) and Abstracts Views on Vision4Press platform.
Data correspond to usage on the plateform after 2015. The current usage metrics is available 48-96 hours after online publication and is updated daily on week days.
Initial download of the metrics may take a while.