Free Access
Fig. 5
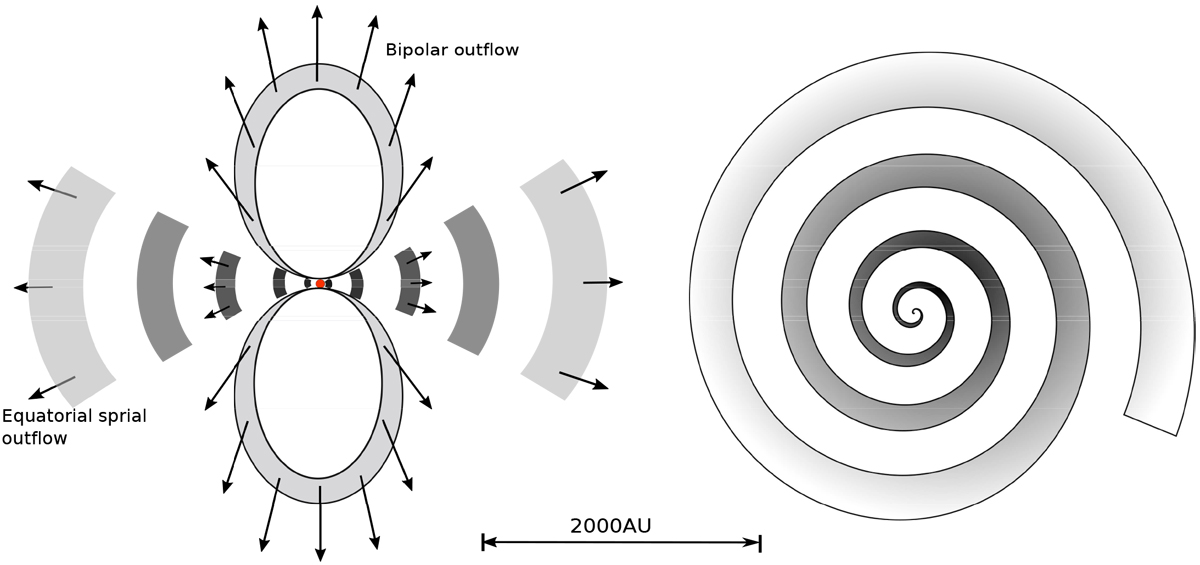
Illustration of the CSE envelope viewed from the side (left) and from the pole (right). The central star, which is not included in the model, is marked by a red dot. The arrows represent the velocity vectors.
Current usage metrics show cumulative count of Article Views (full-text article views including HTML views, PDF and ePub downloads, according to the available data) and Abstracts Views on Vision4Press platform.
Data correspond to usage on the plateform after 2015. The current usage metrics is available 48-96 hours after online publication and is updated daily on week days.
Initial download of the metrics may take a while.