Fig. 3
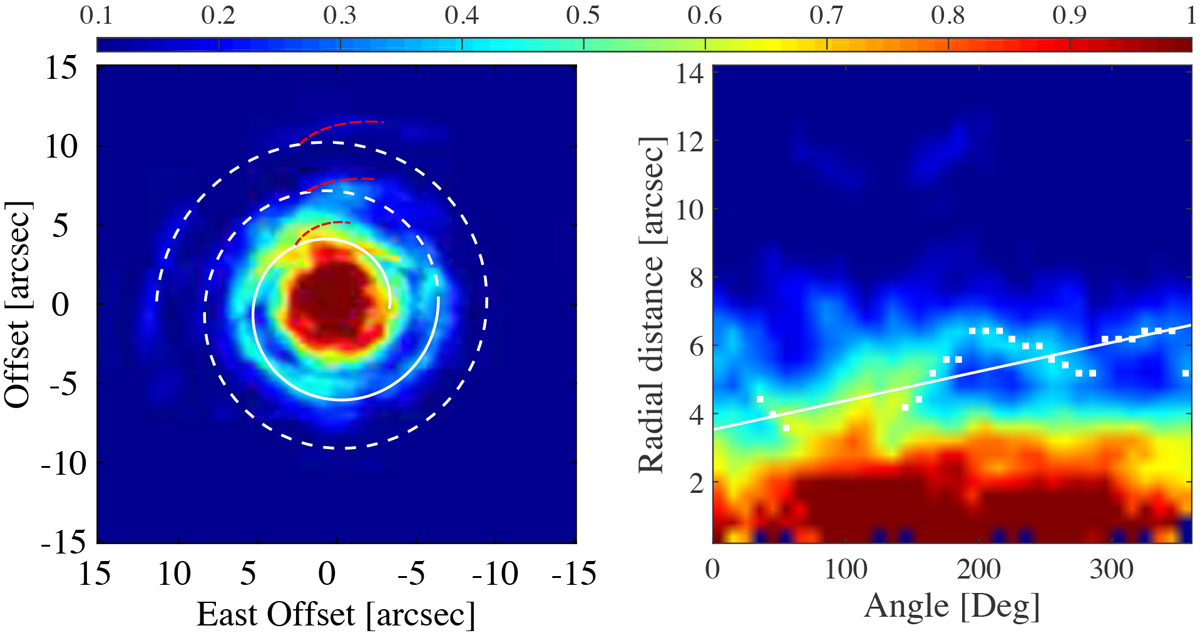
Image collapsed along the spectral axis (left, see Sect. 2), and the corresponding position-angle diagram (right) with the peak positions marked by white squares, and a linear fit to the positions of the first winding. A spiral arm consistent with the fit is plotted on top of the image. A white, dashed part of the spiral is the continuation of the fit. Branches of the windings are marked by the red, dashed line. The flux scale is in Jy beam−1.
Current usage metrics show cumulative count of Article Views (full-text article views including HTML views, PDF and ePub downloads, according to the available data) and Abstracts Views on Vision4Press platform.
Data correspond to usage on the plateform after 2015. The current usage metrics is available 48-96 hours after online publication and is updated daily on week days.
Initial download of the metrics may take a while.