Fig. A.3
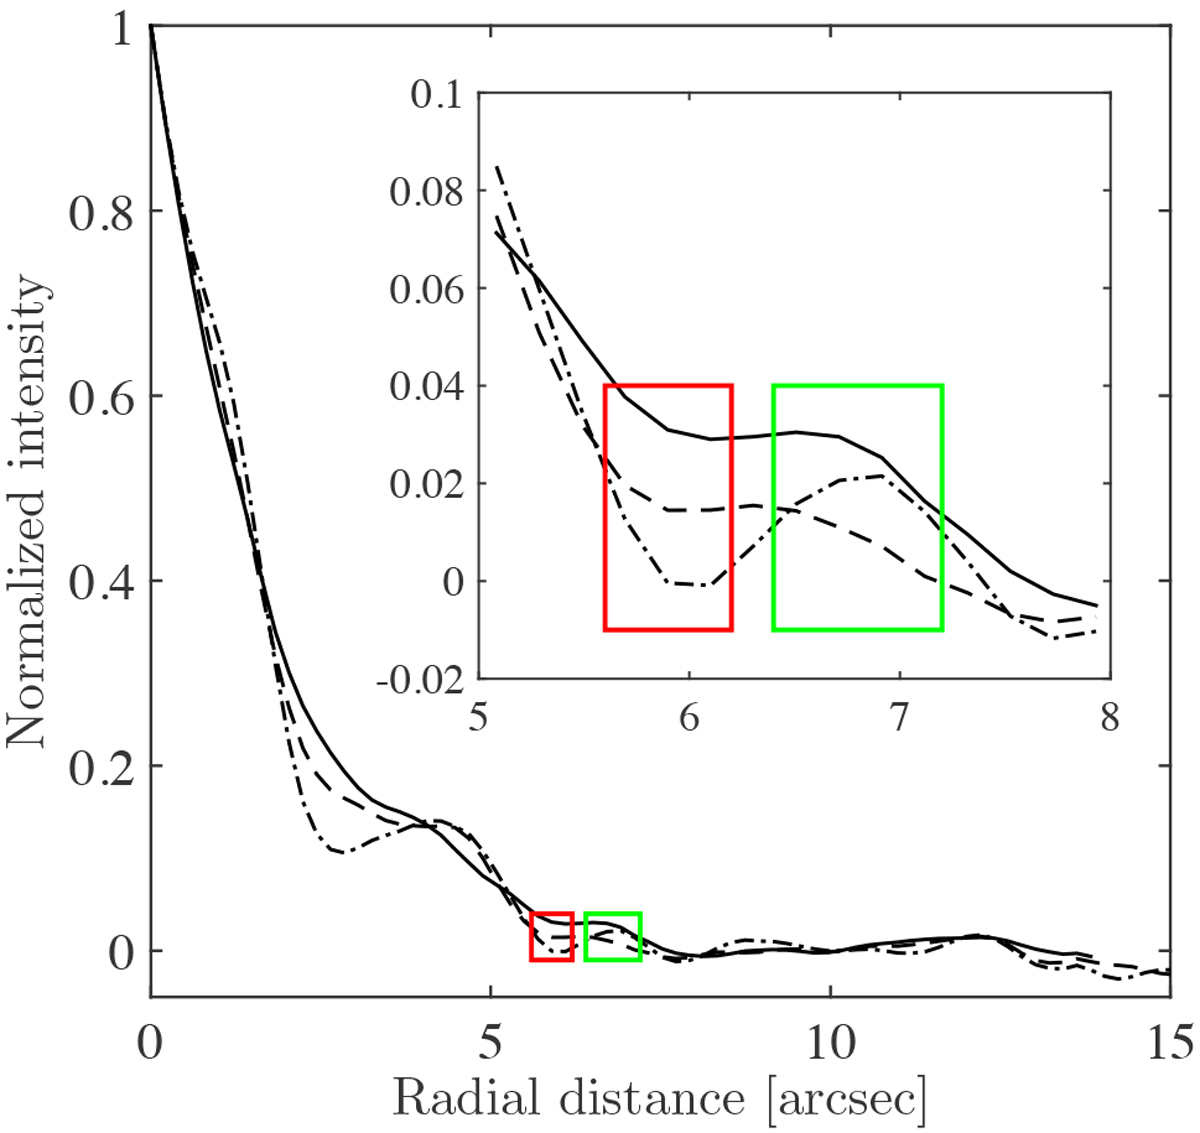
Radial-intensity profile along the direction to the east in the models with the density contrast, β = 5 (dashed-dotted line), 3 (dashed line), and 2 (solid line). The y-axis gives the normalised intensity averaged over 0.2′′ -wide rings within a 10° circle sector. The red and green rectangles are the same as Fig. A.2. The inset plot shows a zoom-in of the region around the rectangles.
Current usage metrics show cumulative count of Article Views (full-text article views including HTML views, PDF and ePub downloads, according to the available data) and Abstracts Views on Vision4Press platform.
Data correspond to usage on the plateform after 2015. The current usage metrics is available 48-96 hours after online publication and is updated daily on week days.
Initial download of the metrics may take a while.