Free Access
Fig. A.2
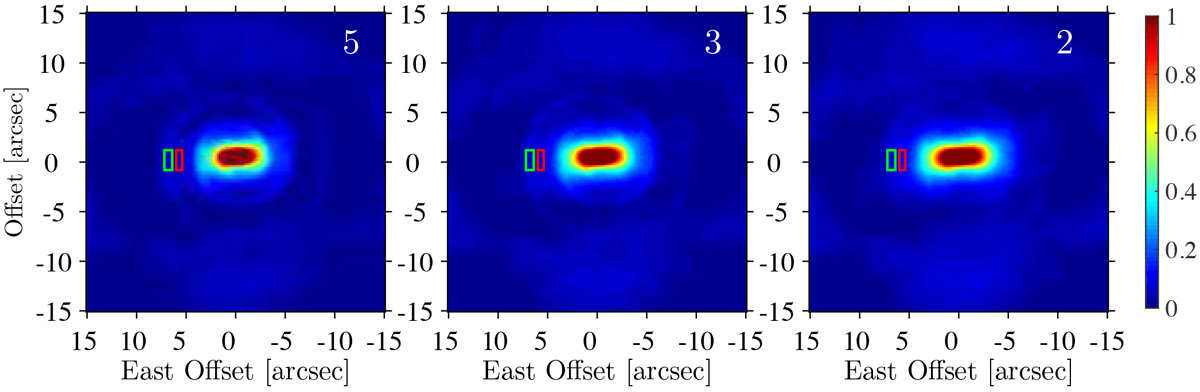
Normalised-intensity images of the integrated intensity of each pixel across the spectrum with different values of β, indicated inthe upper right corner. The red and green rectangles, respectively, indicates the inter-arm region and the spiral arm as explained in the Appendix A.
Current usage metrics show cumulative count of Article Views (full-text article views including HTML views, PDF and ePub downloads, according to the available data) and Abstracts Views on Vision4Press platform.
Data correspond to usage on the plateform after 2015. The current usage metrics is available 48-96 hours after online publication and is updated daily on week days.
Initial download of the metrics may take a while.