Fig. 1
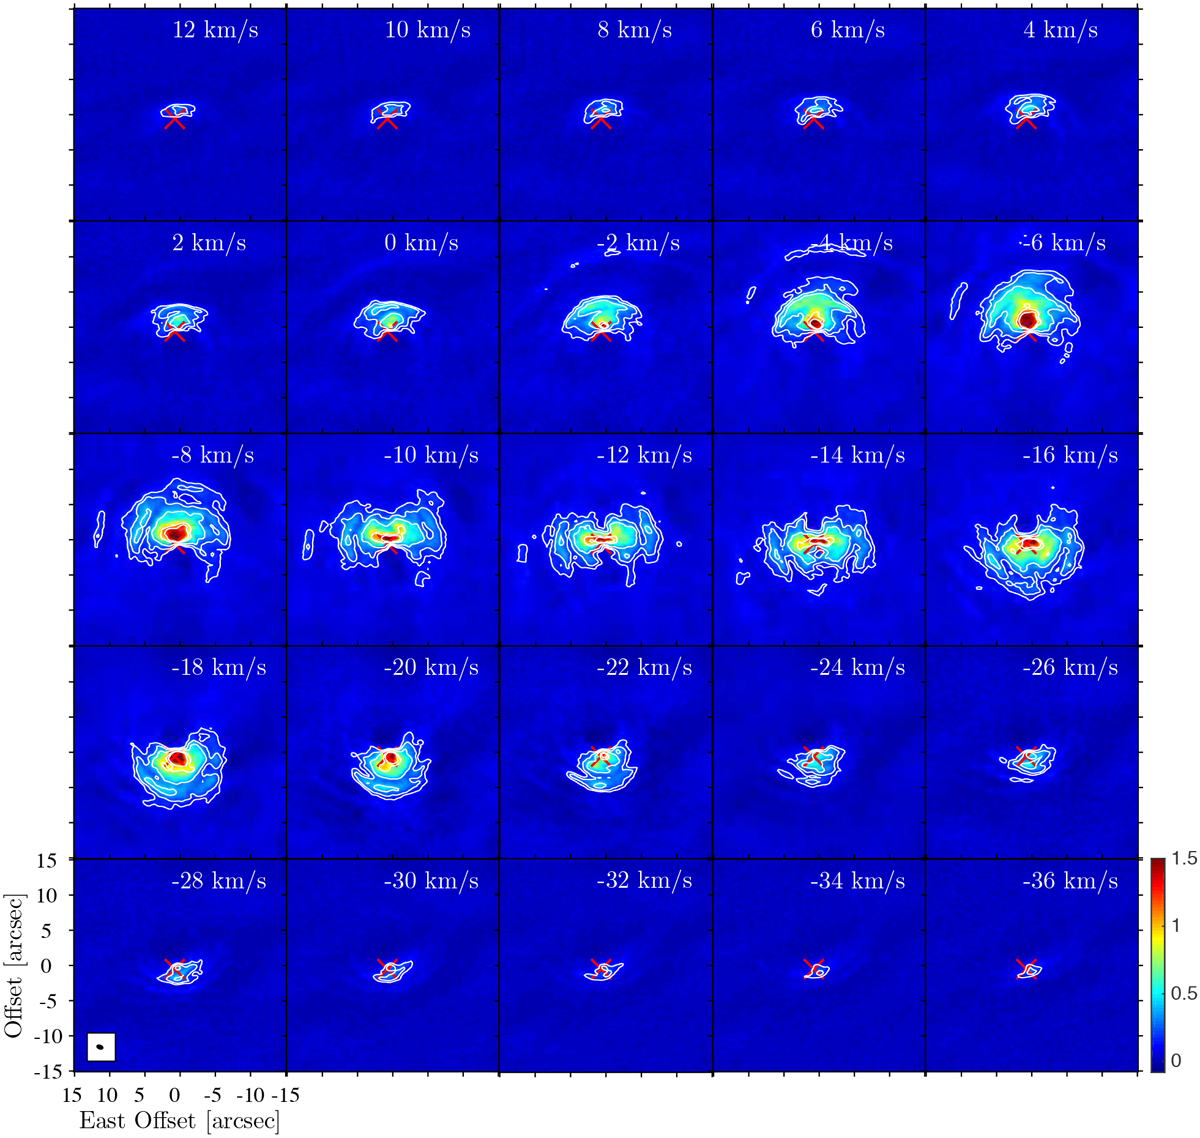
Channel maps of the 12CO J = 3–2 emission with the low-offset velocities. Contour levels are at 6, 10, 18, 40, and 50σ (σ = 0.022 Jy beam−1) and channel separation is 2 km s−1. The synthesised beam is plotted in the lower left corner of the −28 km s−1 channel. The local standard-of-rest velocity is given in the upper right corner of each channel. A cross denotes the stellar position determined from the continuum emission. Colour code for the flux density (Jy beam−1) is given in the colour bar.
Current usage metrics show cumulative count of Article Views (full-text article views including HTML views, PDF and ePub downloads, according to the available data) and Abstracts Views on Vision4Press platform.
Data correspond to usage on the plateform after 2015. The current usage metrics is available 48-96 hours after online publication and is updated daily on week days.
Initial download of the metrics may take a while.