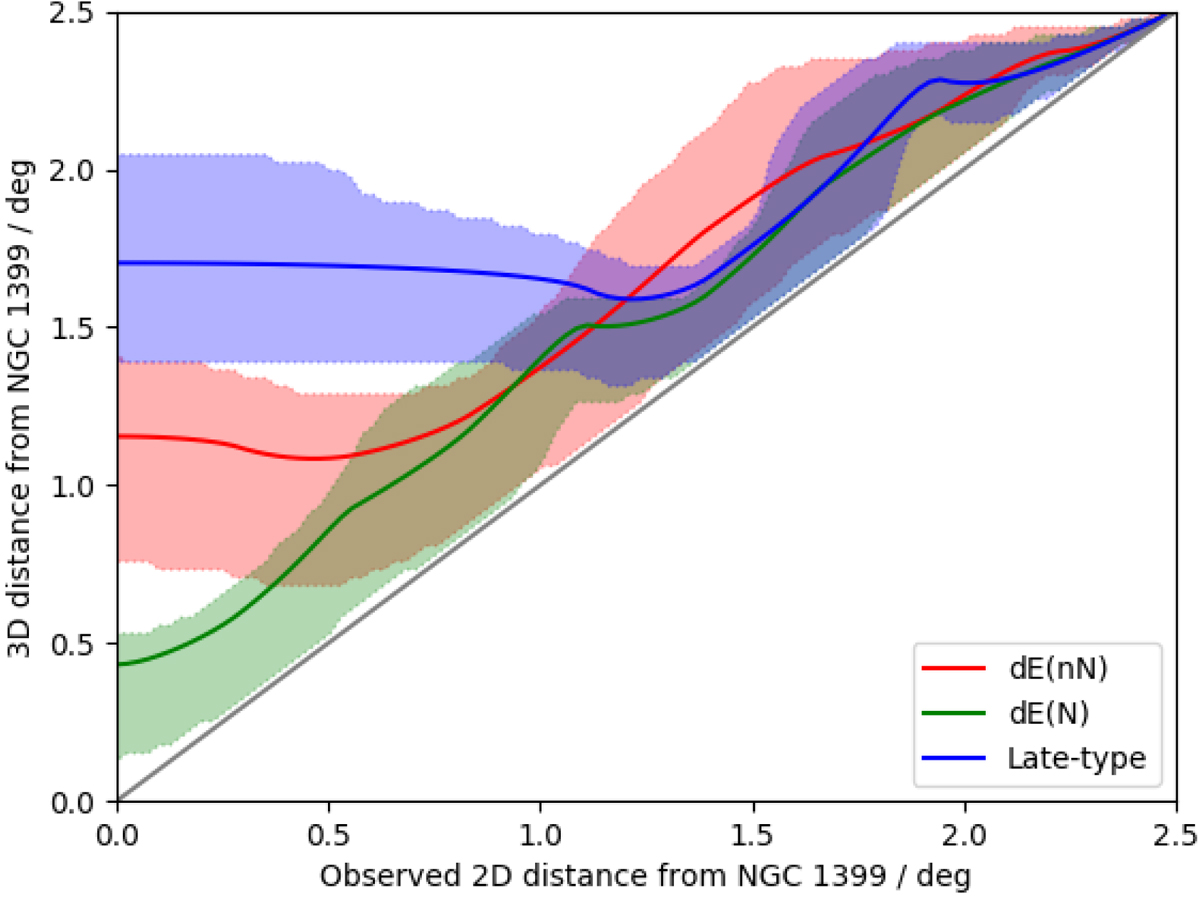
Fig. 15.

Panel rows from top to bottom: g′−r′ color, effective radius (Re), Sérsic index (n), Residual Flux Fraction (RFF), and mean effective surface brightness (![]() ) of the Fornax dwarf galaxies as a function of their cluster-centric distance. The columns correspond to different luminosity bins. The lines and shaded areas show the bin means and uncertainties of the mean for the parameters. The green and purple colors correspond to the values when the projection effects are taken in account (dE(nN)s and late-types excluded from the inner parts as found in Sect. 3.2), and when raw data is used, respectively. The late-type and early-type dwarfs are shown with the blue and red symbols, respectively. The unfilled symbols correspond to the galaxies excluded from the inner parts in order to minimize the projection bias. The ρ parameter indicates Spearman’s correlation coefficient for the correlation of the parameter with distance, and its uncertainty.
) of the Fornax dwarf galaxies as a function of their cluster-centric distance. The columns correspond to different luminosity bins. The lines and shaded areas show the bin means and uncertainties of the mean for the parameters. The green and purple colors correspond to the values when the projection effects are taken in account (dE(nN)s and late-types excluded from the inner parts as found in Sect. 3.2), and when raw data is used, respectively. The late-type and early-type dwarfs are shown with the blue and red symbols, respectively. The unfilled symbols correspond to the galaxies excluded from the inner parts in order to minimize the projection bias. The ρ parameter indicates Spearman’s correlation coefficient for the correlation of the parameter with distance, and its uncertainty.
Current usage metrics show cumulative count of Article Views (full-text article views including HTML views, PDF and ePub downloads, according to the available data) and Abstracts Views on Vision4Press platform.
Data correspond to usage on the plateform after 2015. The current usage metrics is available 48-96 hours after online publication and is updated daily on week days.
Initial download of the metrics may take a while.


