Fig. 10.

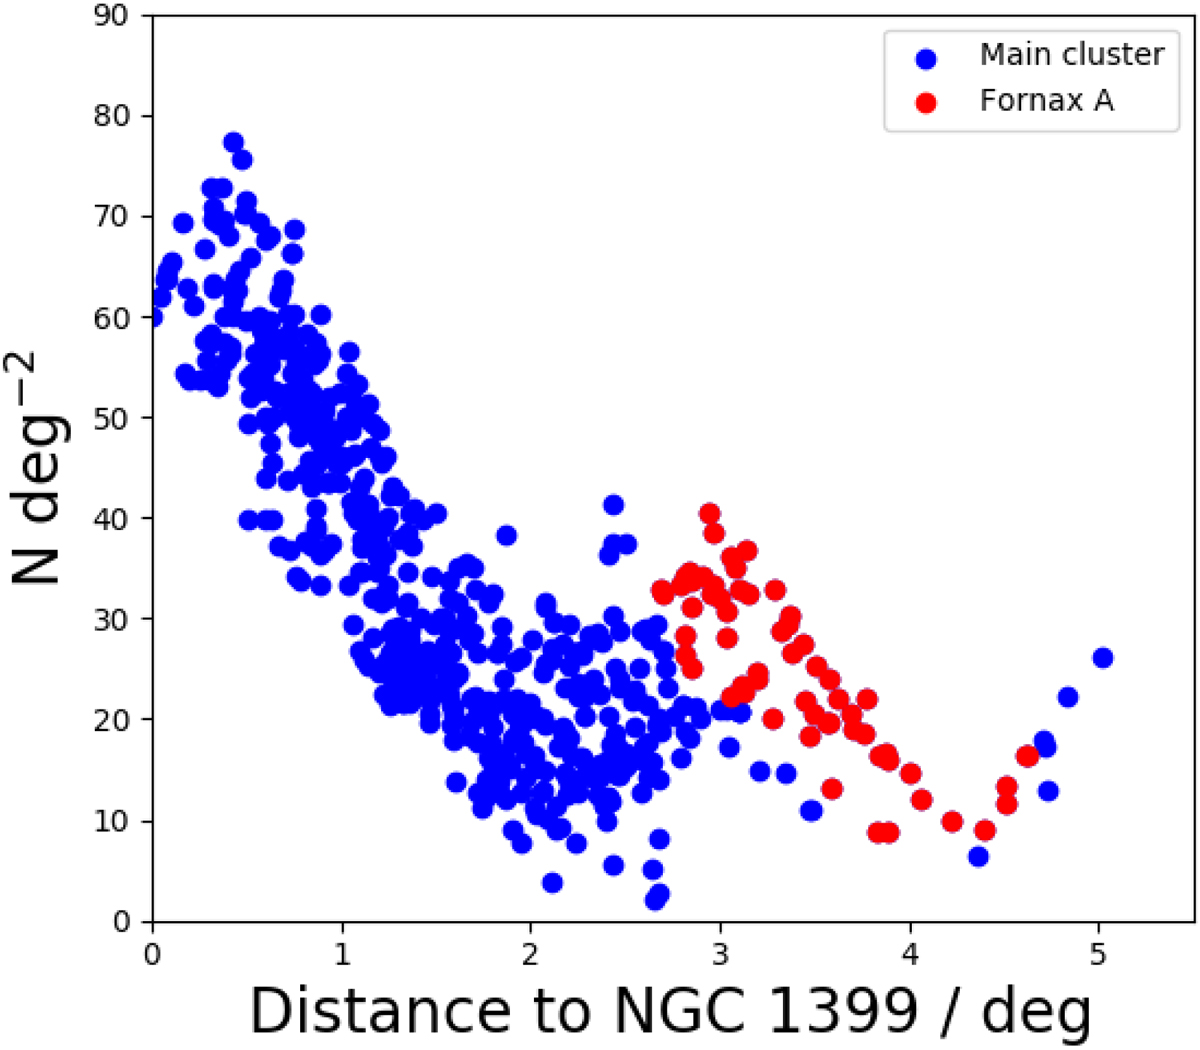
Four upper panels: luminosity function in different spatial bins around the Fornax main cluster and the Fornax A group. At the distance of the Fornax cluster one degree corresponds to 350 kpc. The gray dashed histograms show the observed number of galaxies, and the black histograms show the numbers after correcting for the completeness. The black vertical lines indicate the 50% completeness limit of our catalog. The gray and black curves shows the fitted Schechter function for the observed and completeness corrected luminosity functions, respectively, and the red line in the upper left panel shows the fit for the innermost bin, when the late-type galaxies are excluded from the fit. The fit parameters of each bin are shown in the upper left corner of the panels with the colors corresponding to those of the fitted functions. Lower panels: luminosity distribution for the different types of galaxies in the bins.
Current usage metrics show cumulative count of Article Views (full-text article views including HTML views, PDF and ePub downloads, according to the available data) and Abstracts Views on Vision4Press platform.
Data correspond to usage on the plateform after 2015. The current usage metrics is available 48-96 hours after online publication and is updated daily on week days.
Initial download of the metrics may take a while.


