Fig. 4.
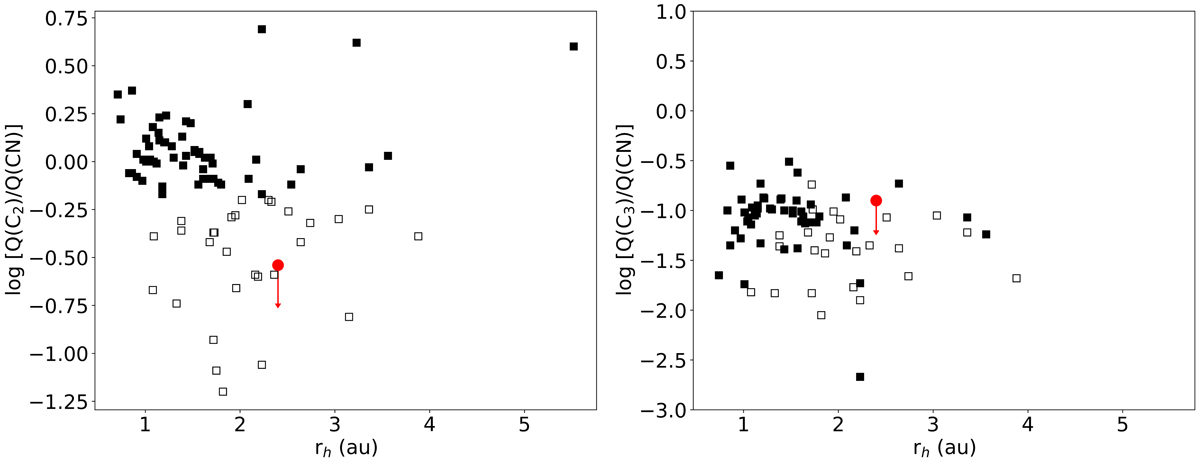
Panel a: comparison between the upper limit for 2I (red data point) and Q(C2)/Q(CN) from the Osip et al. (2003) database for a variety of comets with different Q(CN). Full symbols represent typical comets and open symbols represent carbon-chain depleted comets as defined in A’Hearn et al. (1995). Error bars are omitted for clarity. Panel b: same as panel a but for Q(C3)/Q(CN).
Current usage metrics show cumulative count of Article Views (full-text article views including HTML views, PDF and ePub downloads, according to the available data) and Abstracts Views on Vision4Press platform.
Data correspond to usage on the plateform after 2015. The current usage metrics is available 48-96 hours after online publication and is updated daily on week days.
Initial download of the metrics may take a while.