Fig. 2.
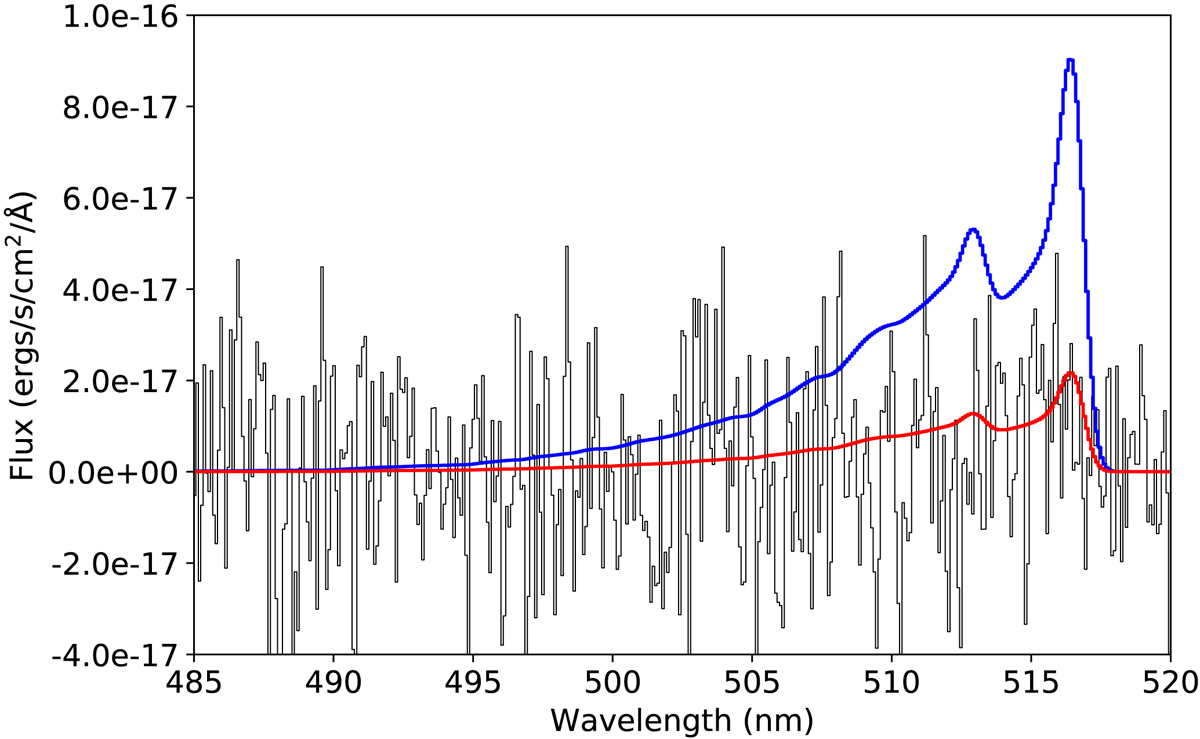
Black data: continuum-subtracted spectrum of 2I/Borisov on 2019 October 13.2 UT in the region of the C2 (0−0) emission band. Blue theoretical spectrum: C2 emission flux through our aperture for a production rate of Q(C2) = 2.5 × 1024 molec/s at a spectral resolution of Δλ = 1 nm. Red theoretical spectrum: as above for Q(C2) = 6 × 10²³ molec/s.
Current usage metrics show cumulative count of Article Views (full-text article views including HTML views, PDF and ePub downloads, according to the available data) and Abstracts Views on Vision4Press platform.
Data correspond to usage on the plateform after 2015. The current usage metrics is available 48-96 hours after online publication and is updated daily on week days.
Initial download of the metrics may take a while.