Fig. 2.
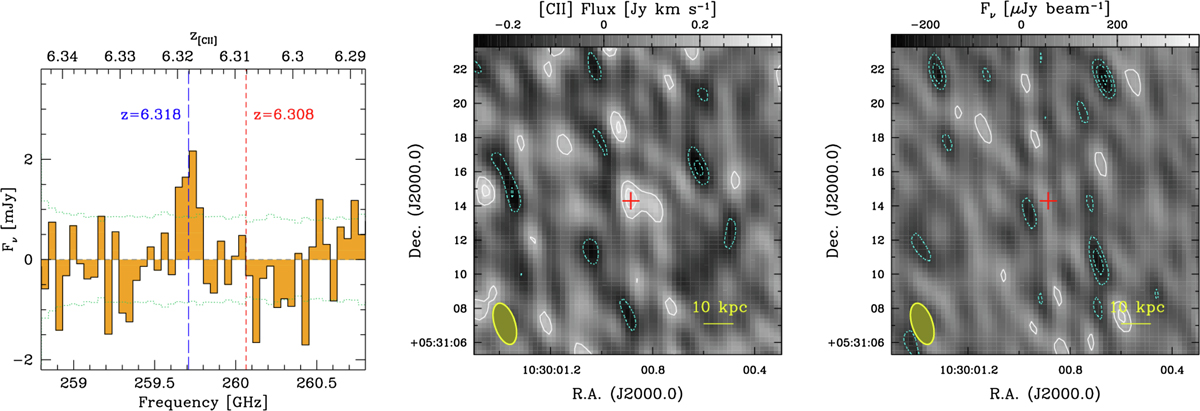
NOEMA observations of ID22914. Left: single-pixel extraction of the 1.2 mm spectrum of ID22914. The green dotted band gives the 1σ range of each channel. The vertical bars show the inferred [C II] redshift of ID22914 (blue long-dashed line) and of J1030+0524 (red short-dashed line). Middle: moment zero map of the [C II] line in ID22914. The field is 19″ × 19″, corresponding to the size of the primary beam. The position of the optical counterpart, located at the pointing center, is indicated by a red cross. The beam and the scale size in physical units are also reported. The contours give the ±2, 3, 4, 5σ levels, with σ = 87 mJy km s−1 beam−1. Positive and negative contours are shown in solid white and dotted cyan lines, respectively. ID22914 is detected at ∼3.5σ level. Right: continuum map of ID22914. The symbols are the same as in the central map, with positive and negative contours indicating the ±2, 3, 4, 5σ levels and σ = 62.3 μJy beam−1. No source is detected.
Current usage metrics show cumulative count of Article Views (full-text article views including HTML views, PDF and ePub downloads, according to the available data) and Abstracts Views on Vision4Press platform.
Data correspond to usage on the plateform after 2015. The current usage metrics is available 48-96 hours after online publication and is updated daily on week days.
Initial download of the metrics may take a while.