Free Access
Fig. 1.
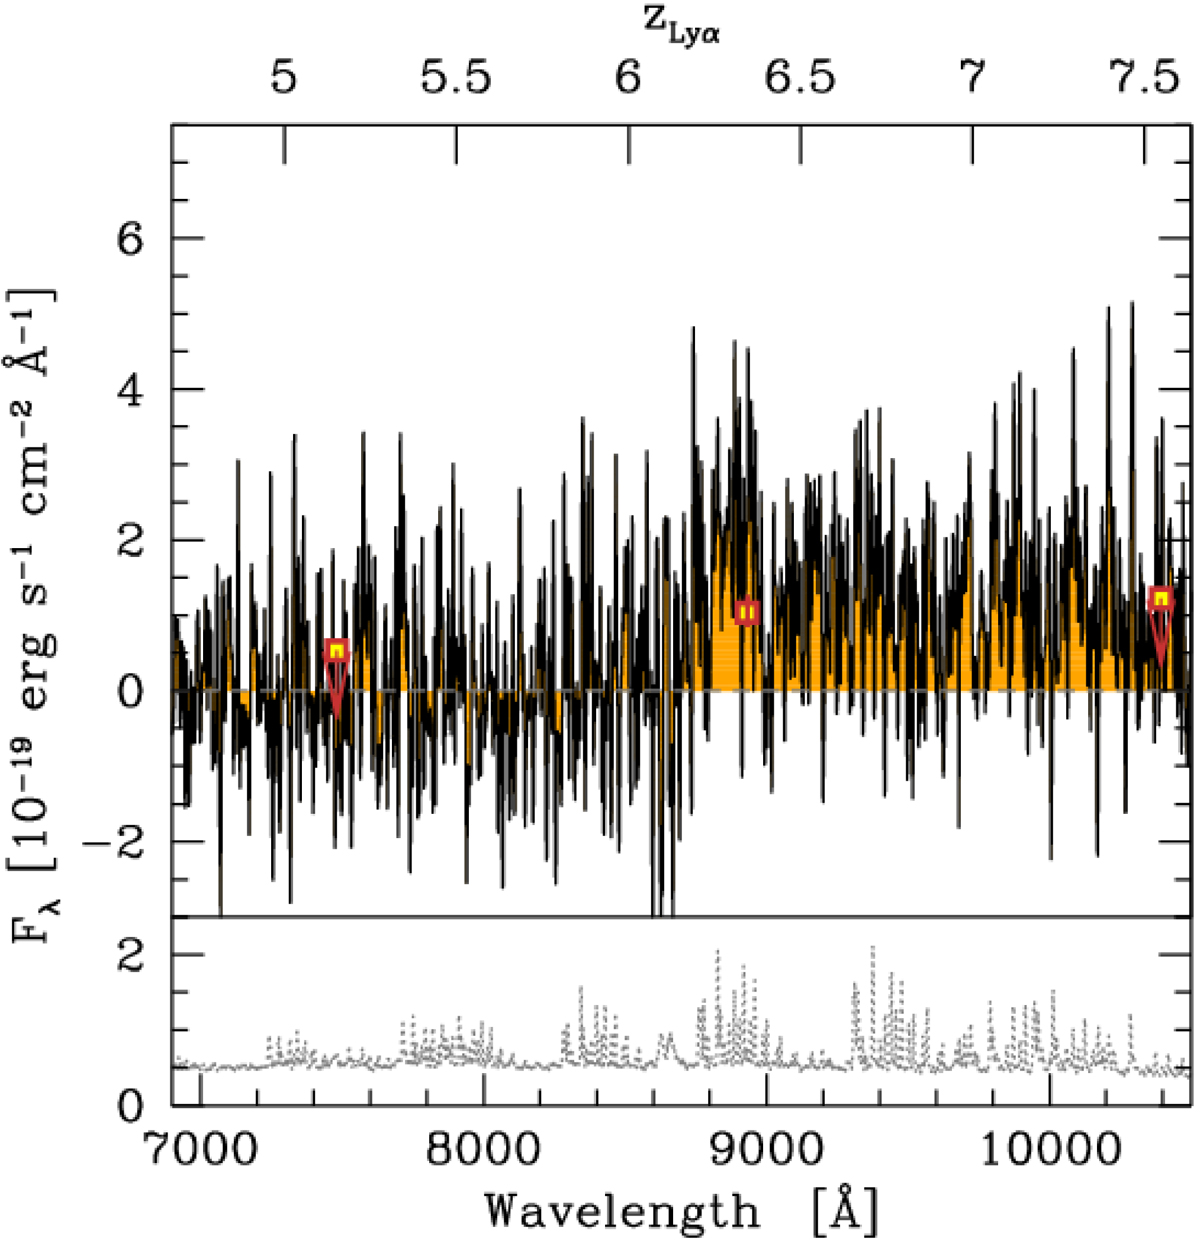
Optical Keck/DEIMOS spectrum of ID22914, the target of our study. Bottom panel: 1σ error spectrum. Red squares indicate the i-, z-, and Y-band photometry. Limits refer to a 3σ significance. The spectrum shows a blue continuum with a break around wavelength ∼8850 Å, implying a Lyα redshift of z ≈ 6.3.
Current usage metrics show cumulative count of Article Views (full-text article views including HTML views, PDF and ePub downloads, according to the available data) and Abstracts Views on Vision4Press platform.
Data correspond to usage on the plateform after 2015. The current usage metrics is available 48-96 hours after online publication and is updated daily on week days.
Initial download of the metrics may take a while.