Free Access
Fig. 4.
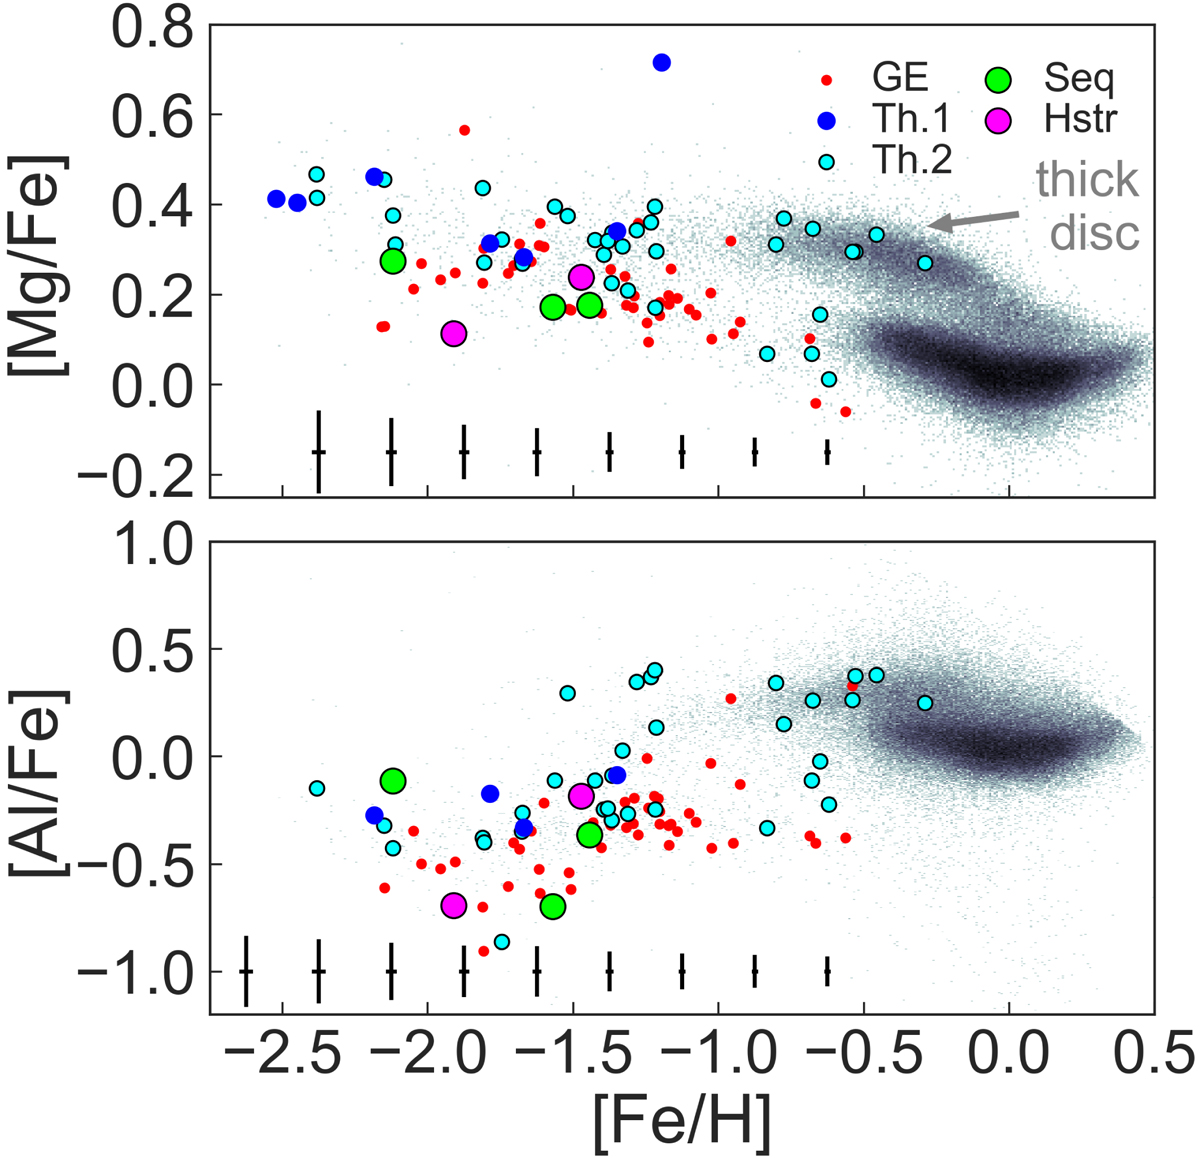
Detailed chemical abundances (from APOGEE) for stars in the different substructures. The bars at the bottom of the panel indicate the mean error at that [Fe/H]. In the background we show a 2D histogram of all of the stars in our dataset, colour-coded by the logarithm of the number of stars per bin.
Current usage metrics show cumulative count of Article Views (full-text article views including HTML views, PDF and ePub downloads, according to the available data) and Abstracts Views on Vision4Press platform.
Data correspond to usage on the plateform after 2015. The current usage metrics is available 48-96 hours after online publication and is updated daily on week days.
Initial download of the metrics may take a while.