Fig. 1.
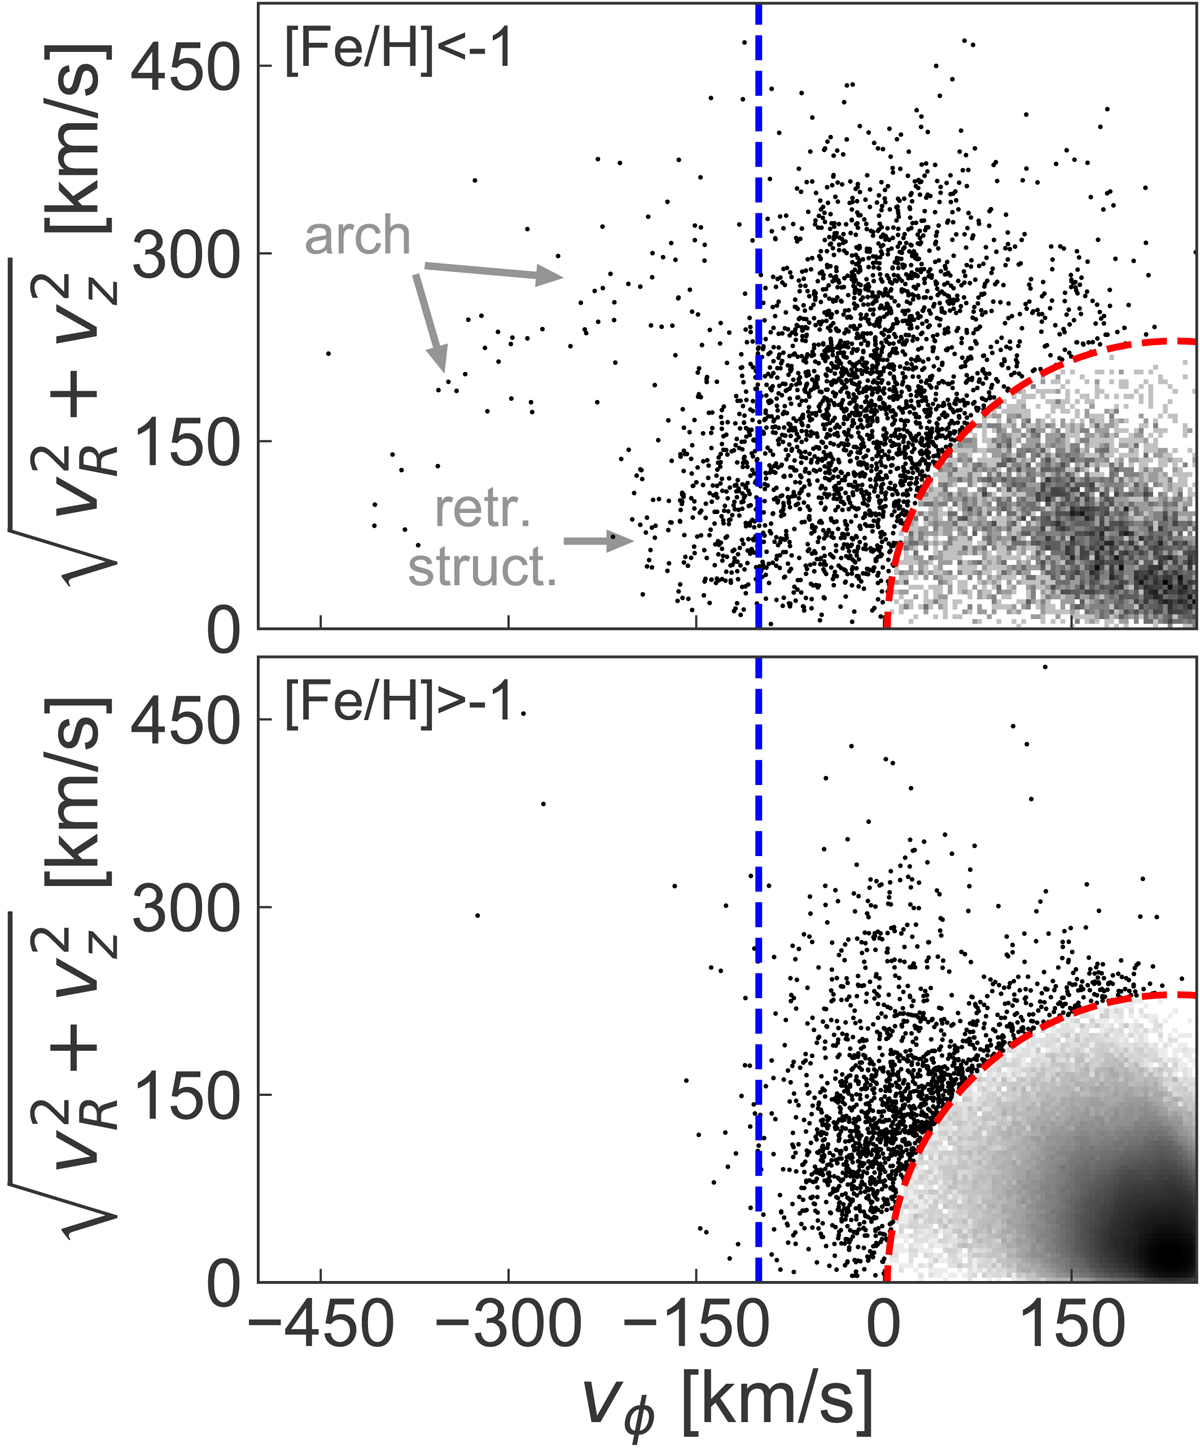
Velocity diagram of the local (d < 1 kpc) stellar halo split in a metal-poor (top) and a metal-rich sample (bottom). The colour-coding of the 2D histogram scales with the logarithm of the number of stars in each bin. All stars outside of the red dashed line are tentatively labelled as halo stars and are shown as black dots. We note that most if not all of the halo left of the dashed vertical line (vϕ < −100 km s−1) is more metal-poor than [Fe/H] = −1.
Current usage metrics show cumulative count of Article Views (full-text article views including HTML views, PDF and ePub downloads, according to the available data) and Abstracts Views on Vision4Press platform.
Data correspond to usage on the plateform after 2015. The current usage metrics is available 48-96 hours after online publication and is updated daily on week days.
Initial download of the metrics may take a while.