Fig. 14.
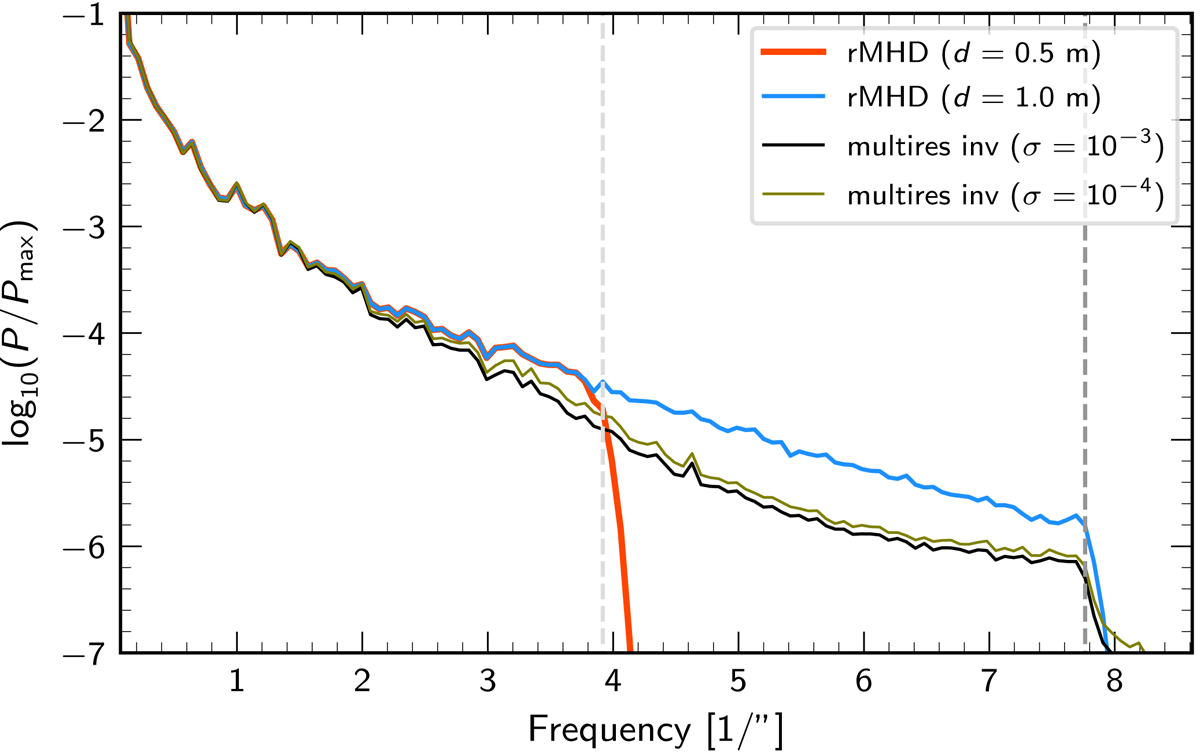
Azimutal integral of 2D power spectra computed from B∥ maps: from multi-resolution inversion (black), from rMHD simulation with frequency cut-off filter corresponding to d = 1 m (blue) and d = 0.5 m (red). The theoretical cut-off limits of 0.5 m and 1.0 m aperture telescopes (λ/d) are indicated with light-gray and dark-gray vertical lines. The green curve illustrates the power spectra of a multi-resolution inversion performed with less noisy data (σ = 10−4).
Current usage metrics show cumulative count of Article Views (full-text article views including HTML views, PDF and ePub downloads, according to the available data) and Abstracts Views on Vision4Press platform.
Data correspond to usage on the plateform after 2015. The current usage metrics is available 48-96 hours after online publication and is updated daily on week days.
Initial download of the metrics may take a while.