Free Access
Fig. 12.
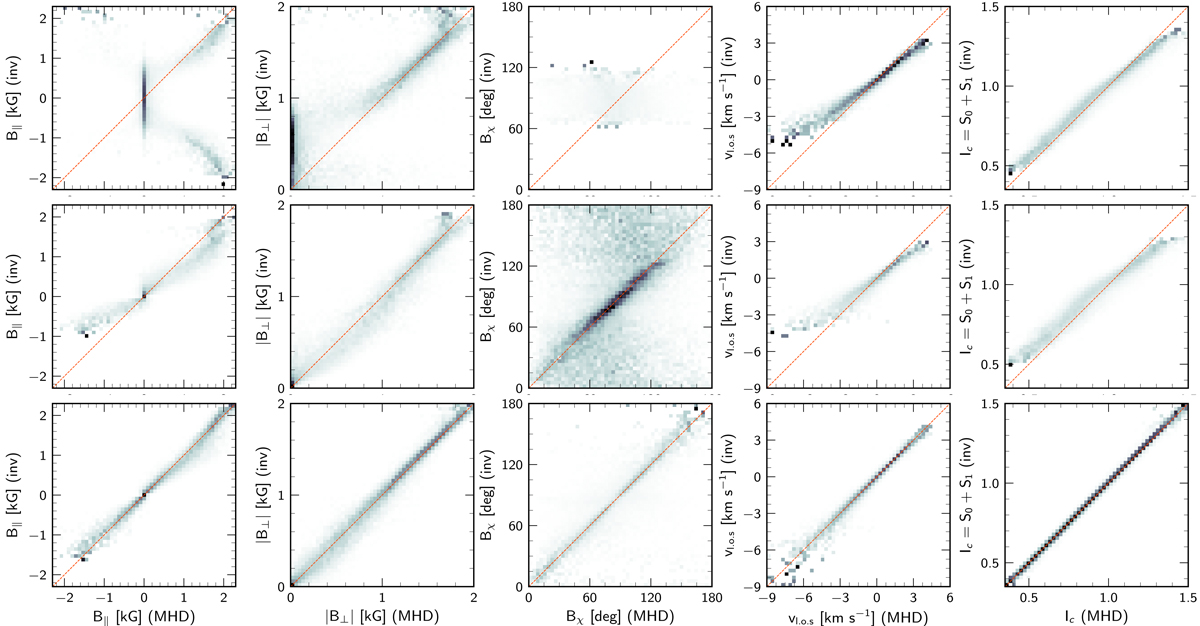
Density maps comparing inversion results from Fig. 11 to parameters of the rMHD model. The panels are arranged in the same order as in the former figure. Each row has been normalized by the integral of the histogram along that row to better illustrate the spread around each value.
Current usage metrics show cumulative count of Article Views (full-text article views including HTML views, PDF and ePub downloads, according to the available data) and Abstracts Views on Vision4Press platform.
Data correspond to usage on the plateform after 2015. The current usage metrics is available 48-96 hours after online publication and is updated daily on week days.
Initial download of the metrics may take a while.