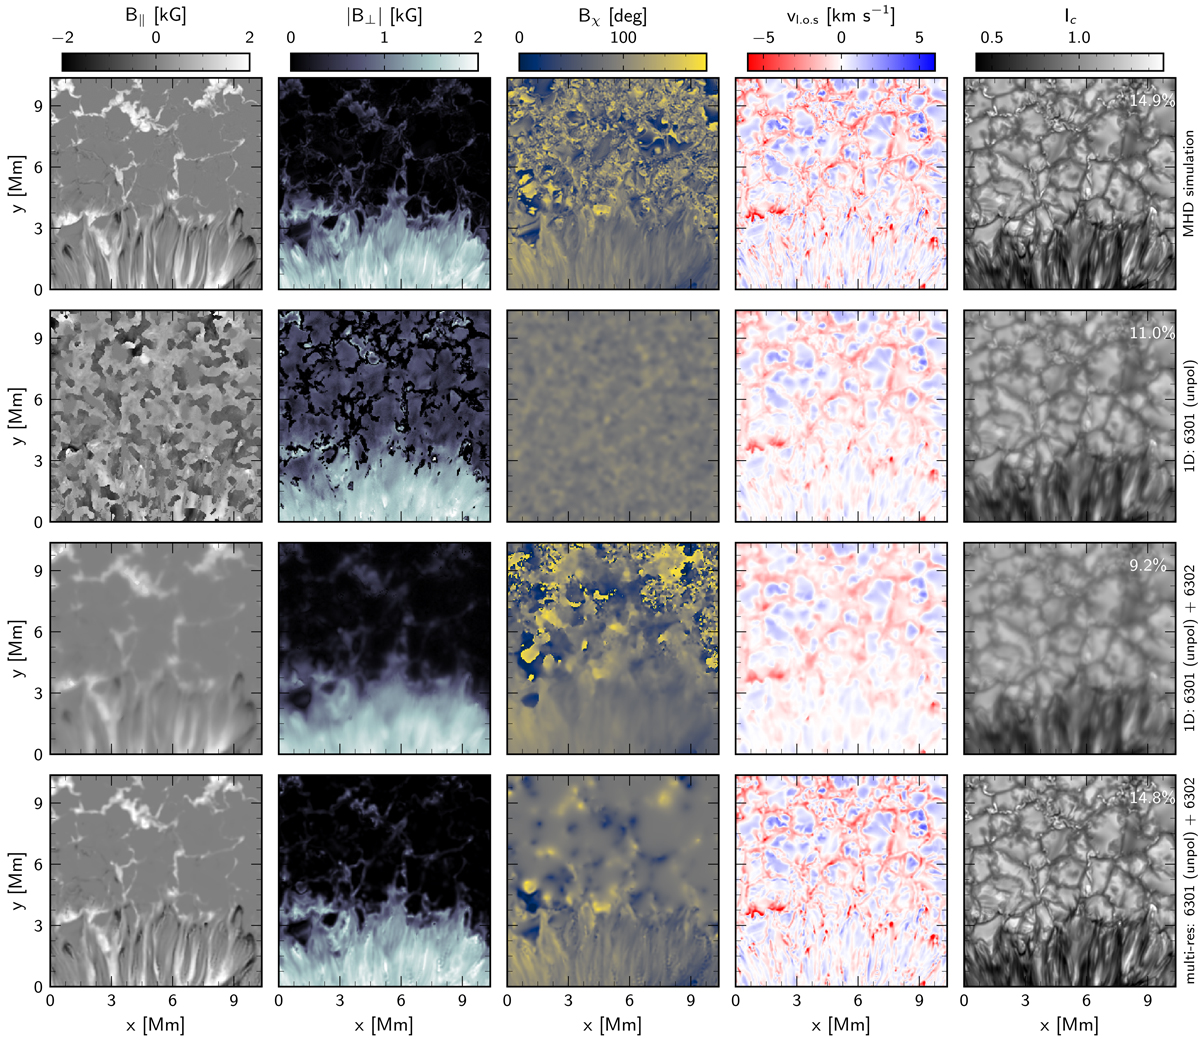
Fig. 11.
Comparison of inversion results. From left to right: longitudinal component of magnetic field, unsigned transverse component of magnetic field, magnetic field azimuth, line-of-sight velocity, and continuum intensity. From top to bottom: original rMHD simulation (which was resampled to grid of highest resolution dataset), inversion results from experiment 1, results from experiment 2, and results from experiment 3 (see Table 1). The granulation continuum intensity contrast is marked in the rightmost panel. The continuum intensity in the lower three rows in computed as Ic = S0 + S1.
Current usage metrics show cumulative count of Article Views (full-text article views including HTML views, PDF and ePub downloads, according to the available data) and Abstracts Views on Vision4Press platform.
Data correspond to usage on the plateform after 2015. The current usage metrics is available 48-96 hours after online publication and is updated daily on week days.
Initial download of the metrics may take a while.