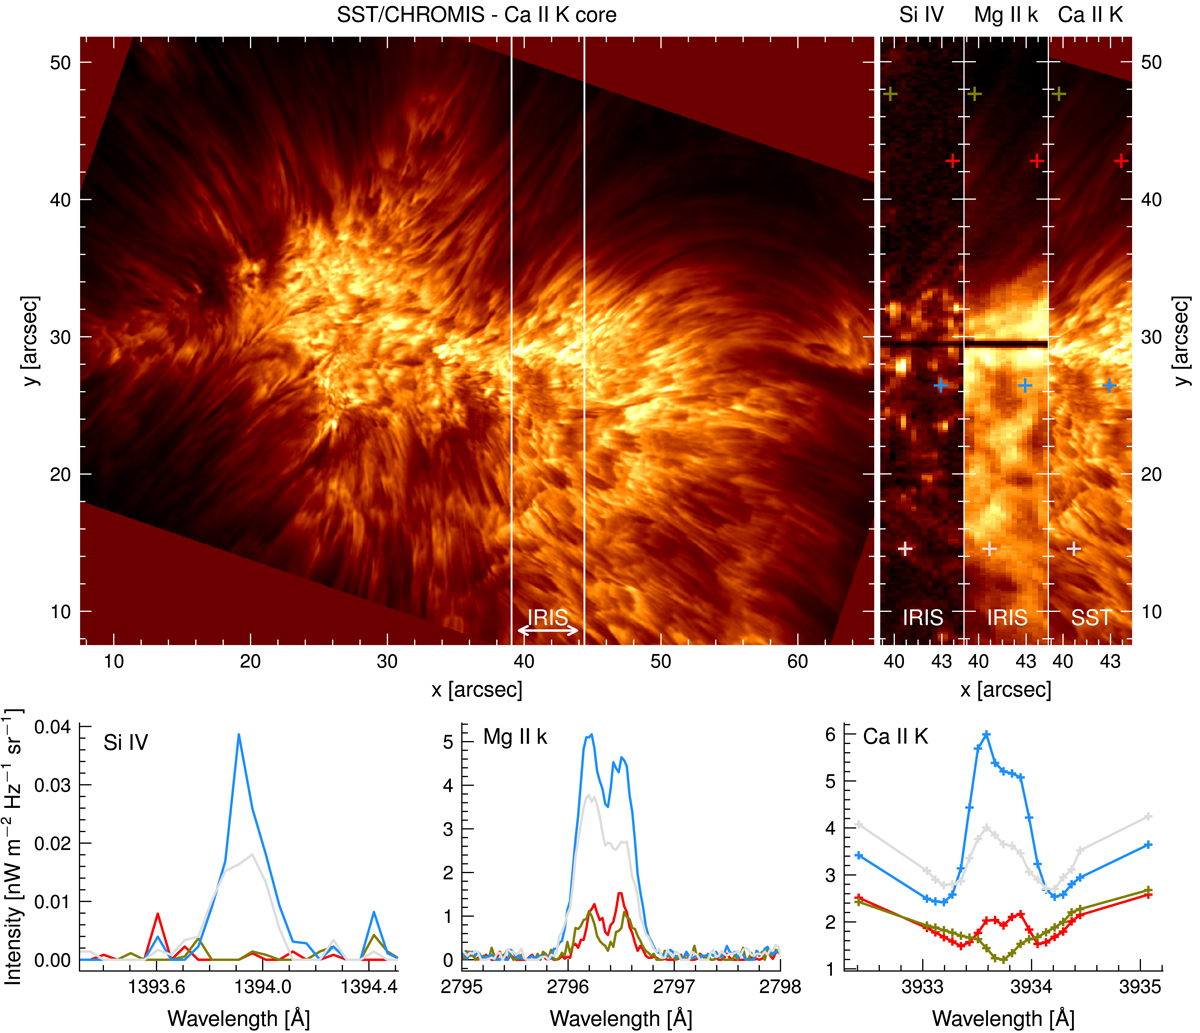
Fig. 1.

Chromospheric plage observation. The datasets were acquired with CHROMIS at the Swedish 1 m Solar Telescope and with NASA’s IRIS satellite on 2016-09-14 at 09:06 UT. Upper-left panel: CHROMIS field-of-view where the IRIS raster scan has been indicated. Three upper rightmost panels: overlapping FOV for a given time-step in the core of the Si IV 1400 Å line, the Mg II k line, and the Ca II K line. The colored crosses indicate the location of example spectra, shown in the bottom row with the same color coding for each line.
Current usage metrics show cumulative count of Article Views (full-text article views including HTML views, PDF and ePub downloads, according to the available data) and Abstracts Views on Vision4Press platform.
Data correspond to usage on the plateform after 2015. The current usage metrics is available 48-96 hours after online publication and is updated daily on week days.
Initial download of the metrics may take a while.


