Fig. C.2.
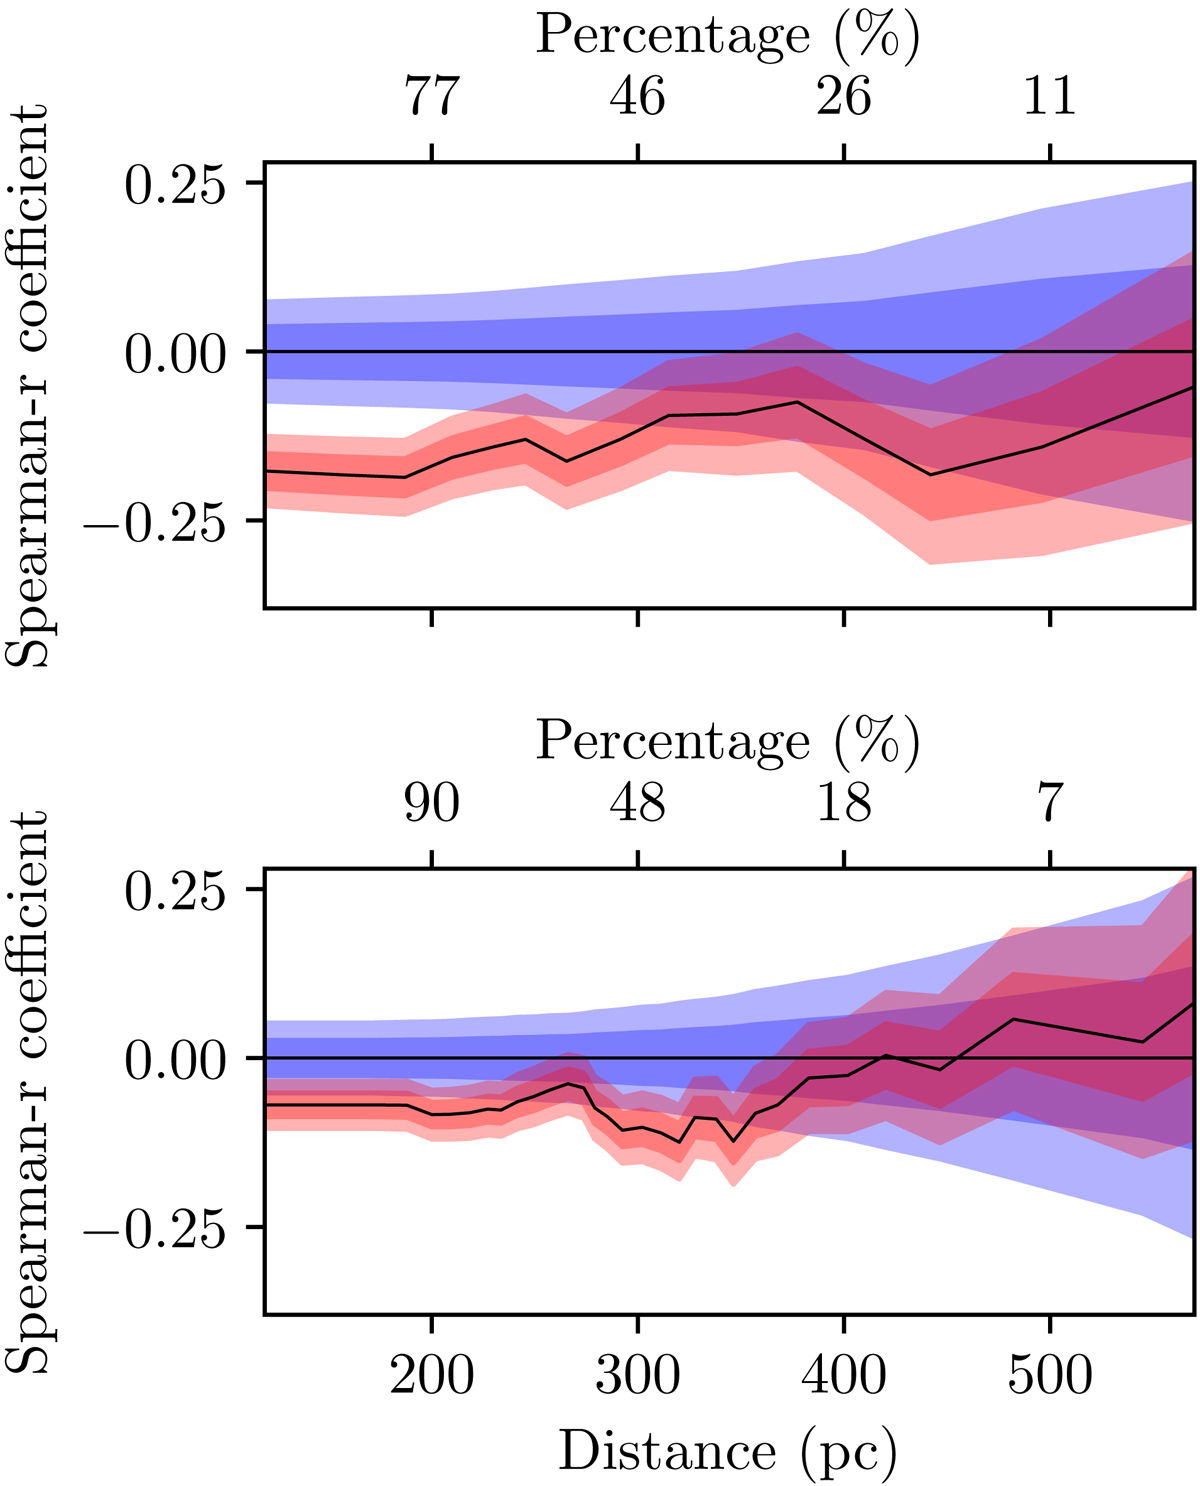
Top panel: spearman rank coefficient of the high-latitude lines of sight as a function of the truncated samples is shown with the solid black curve. Distances correspond to the minimum distance of each truncated sample in which we compute the correlation coefficient. The red shaded regions correspond to the 1 and 2σ deviations, respectively. The blue shaded regions correspond to 1 and 2σ deviations of the uncorrelated case, respectively. Bottom panel: same for the intermediate-latitude sample.
Current usage metrics show cumulative count of Article Views (full-text article views including HTML views, PDF and ePub downloads, according to the available data) and Abstracts Views on Vision4Press platform.
Data correspond to usage on the plateform after 2015. The current usage metrics is available 48-96 hours after online publication and is updated daily on week days.
Initial download of the metrics may take a while.