Fig. A.1.
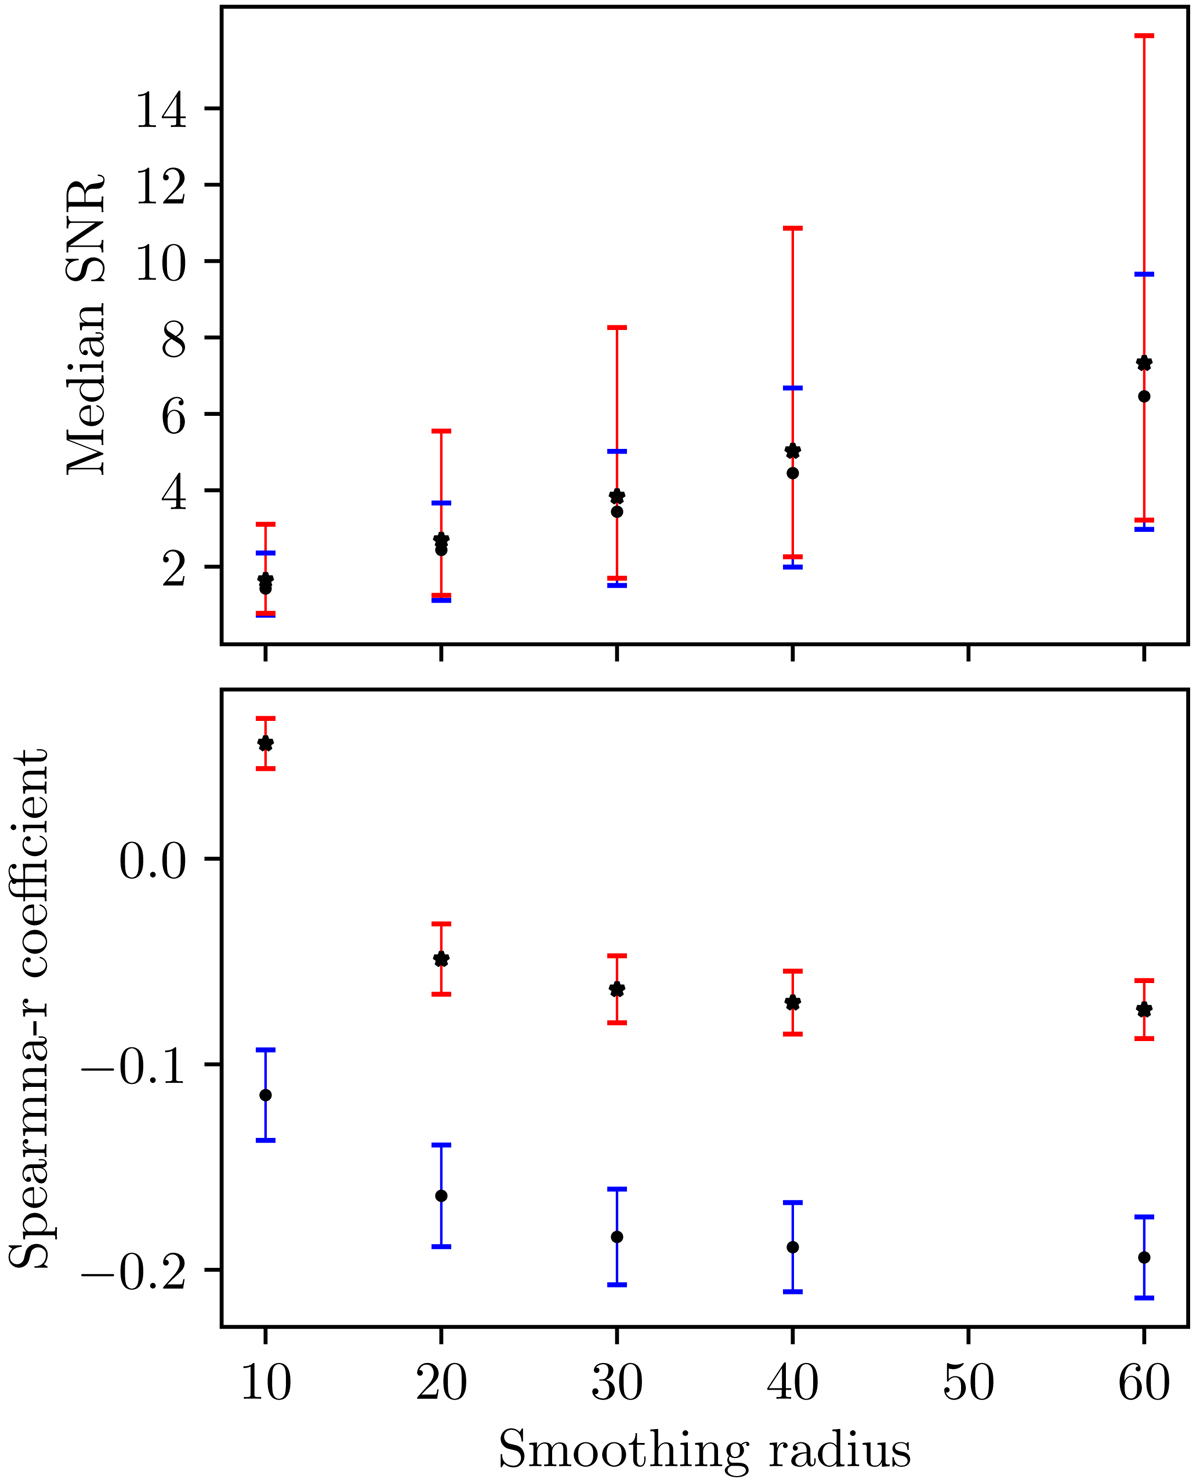
Asterisk markers with red error-bar lines correspond to the intermediate-latitude sample, and dot markers with blue error-bar lines to the high-latitude sample. Top panel: median S/N of PS as a function of smoothing radius. The error bars correspond to the 68% percentile of the distribution. Bottom panel: mean Spearman r-coefficient derived from a distribution using mock data as a function of the smoothing radius. The 1σ error bars correspond to propagated observational uncertainties.
Current usage metrics show cumulative count of Article Views (full-text article views including HTML views, PDF and ePub downloads, according to the available data) and Abstracts Views on Vision4Press platform.
Data correspond to usage on the plateform after 2015. The current usage metrics is available 48-96 hours after online publication and is updated daily on week days.
Initial download of the metrics may take a while.