Fig. 2.
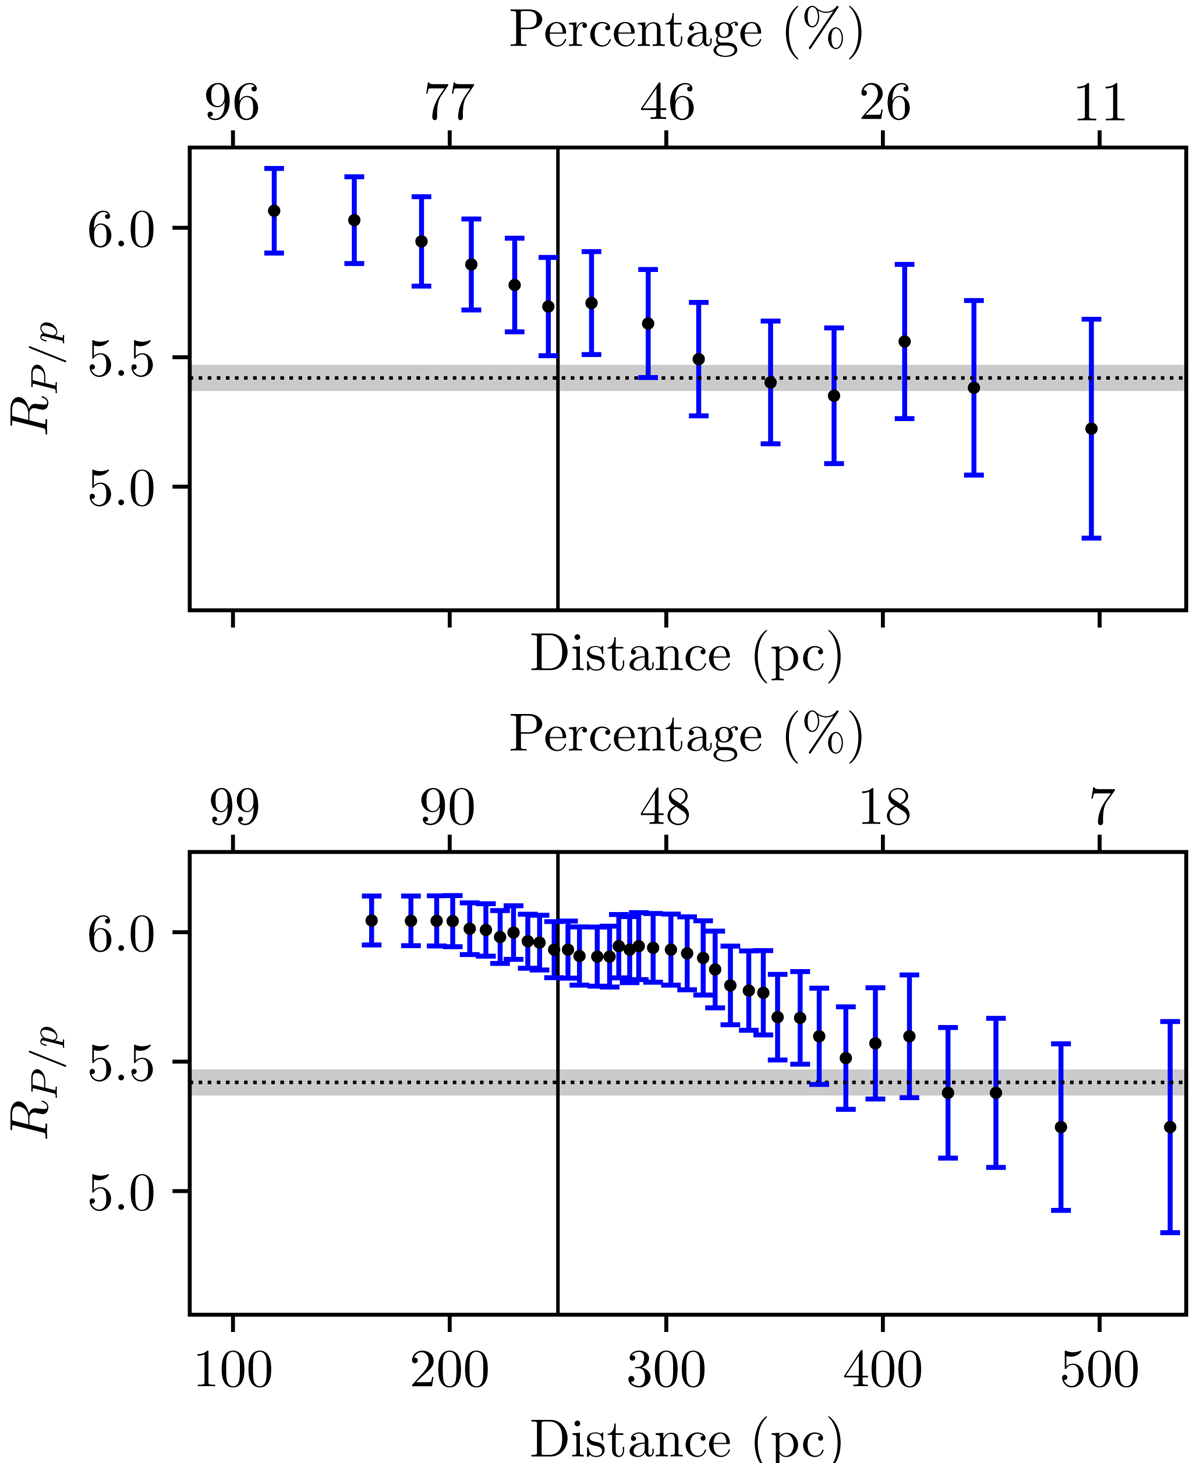
Top panel: median RP/p of the high-latitude lines of sight as a function of the fraction of the truncated samples. Distances correspond to the minimum distance of each truncated sample in which we computed RP/p. The dotted horizontal line corresponds to the mean RP/p value, 5.42 MJy sr−1, and the gray band to its one-sigma errors. Bottom panel: same as above for the intermediate-latitude lines of sight.
Current usage metrics show cumulative count of Article Views (full-text article views including HTML views, PDF and ePub downloads, according to the available data) and Abstracts Views on Vision4Press platform.
Data correspond to usage on the plateform after 2015. The current usage metrics is available 48-96 hours after online publication and is updated daily on week days.
Initial download of the metrics may take a while.