Fig. 9
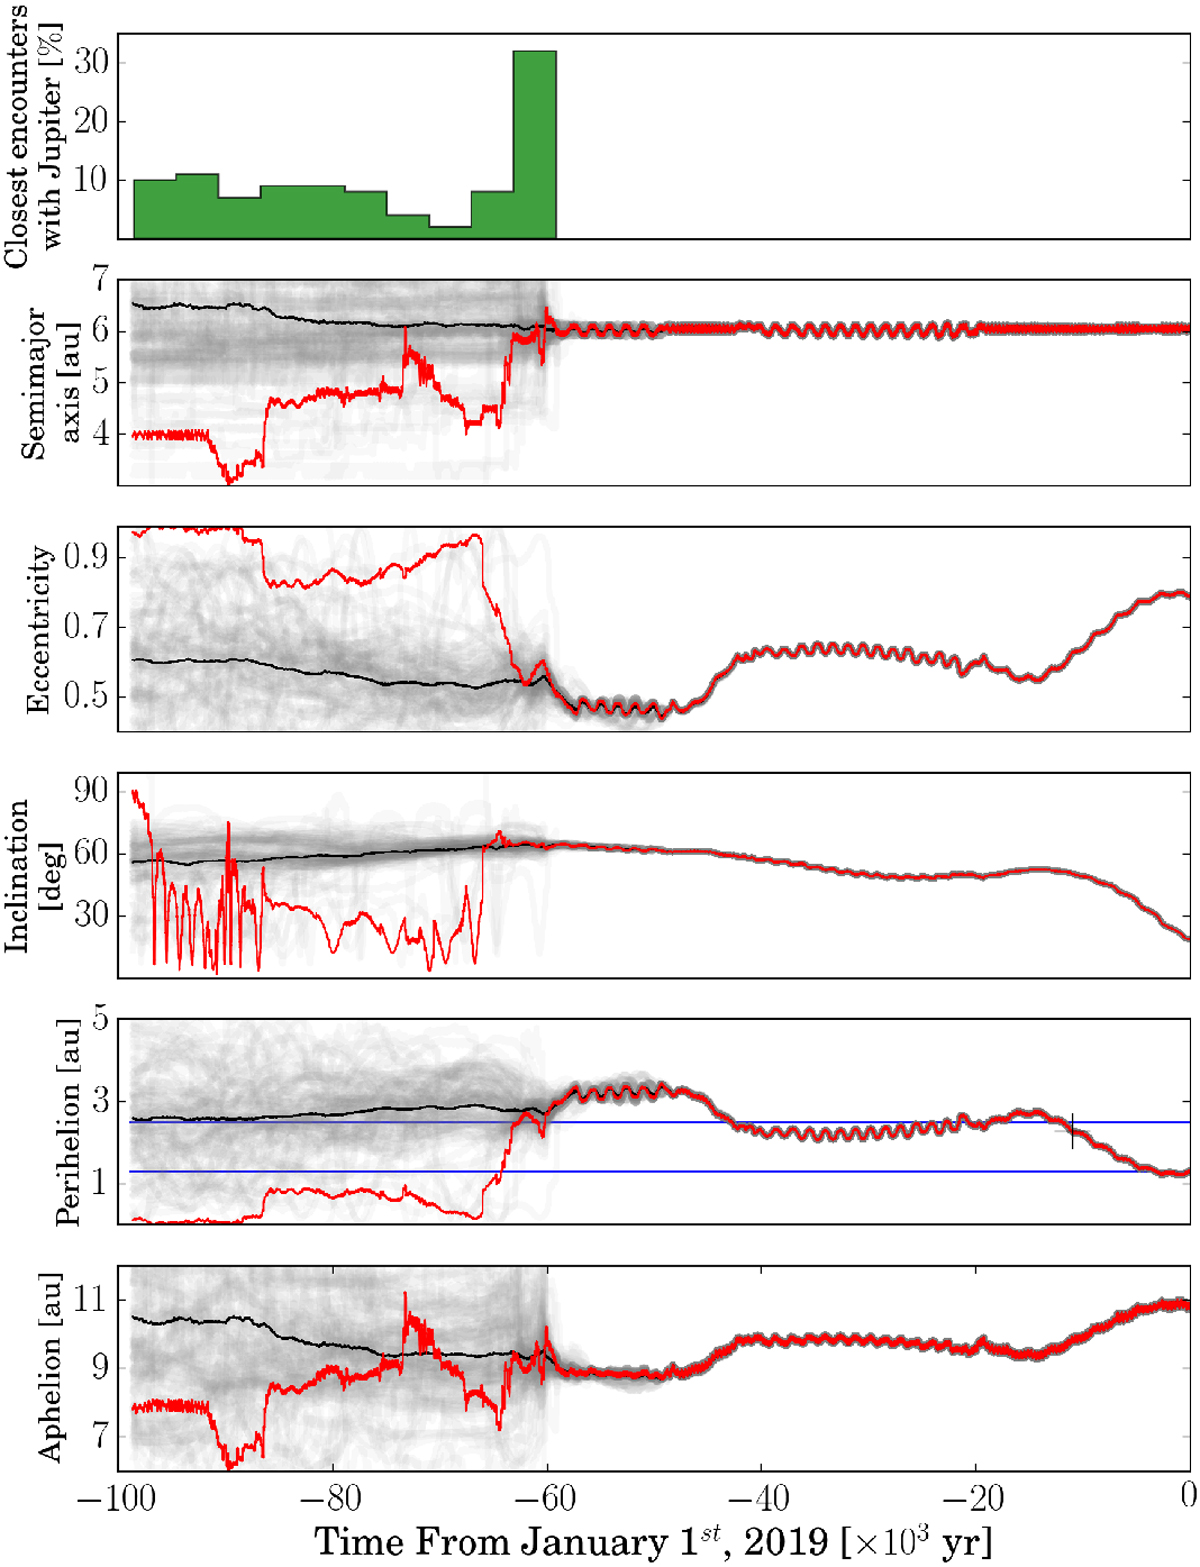
Orbital evolution of 66P and its 200 clones for 105 yr backwardin time from January 1, 2019. From the top to the bottom: the closest approaches with Jupiter, semi-major axis, eccentricity, inclination, perihelion, and aphelion distance. In all cases the red lines correspond to the evolution of the nominal comet 66P, the black lines are the mean values of the whole set of 200 clones plus the nominal comet, and the gray lines show the individual evolution for each clone. In the perihelion panel the black cross indicates the time of the capture, tcap, and the two horizontal blue bars correspond to q = 1.3 and q = 2.5 au. The initial orbital elements were taken from the JPL Small-Body Data Browser.
Current usage metrics show cumulative count of Article Views (full-text article views including HTML views, PDF and ePub downloads, according to the available data) and Abstracts Views on Vision4Press platform.
Data correspond to usage on the plateform after 2015. The current usage metrics is available 48-96 hours after online publication and is updated daily on week days.
Initial download of the metrics may take a while.