Free Access
Fig. 8
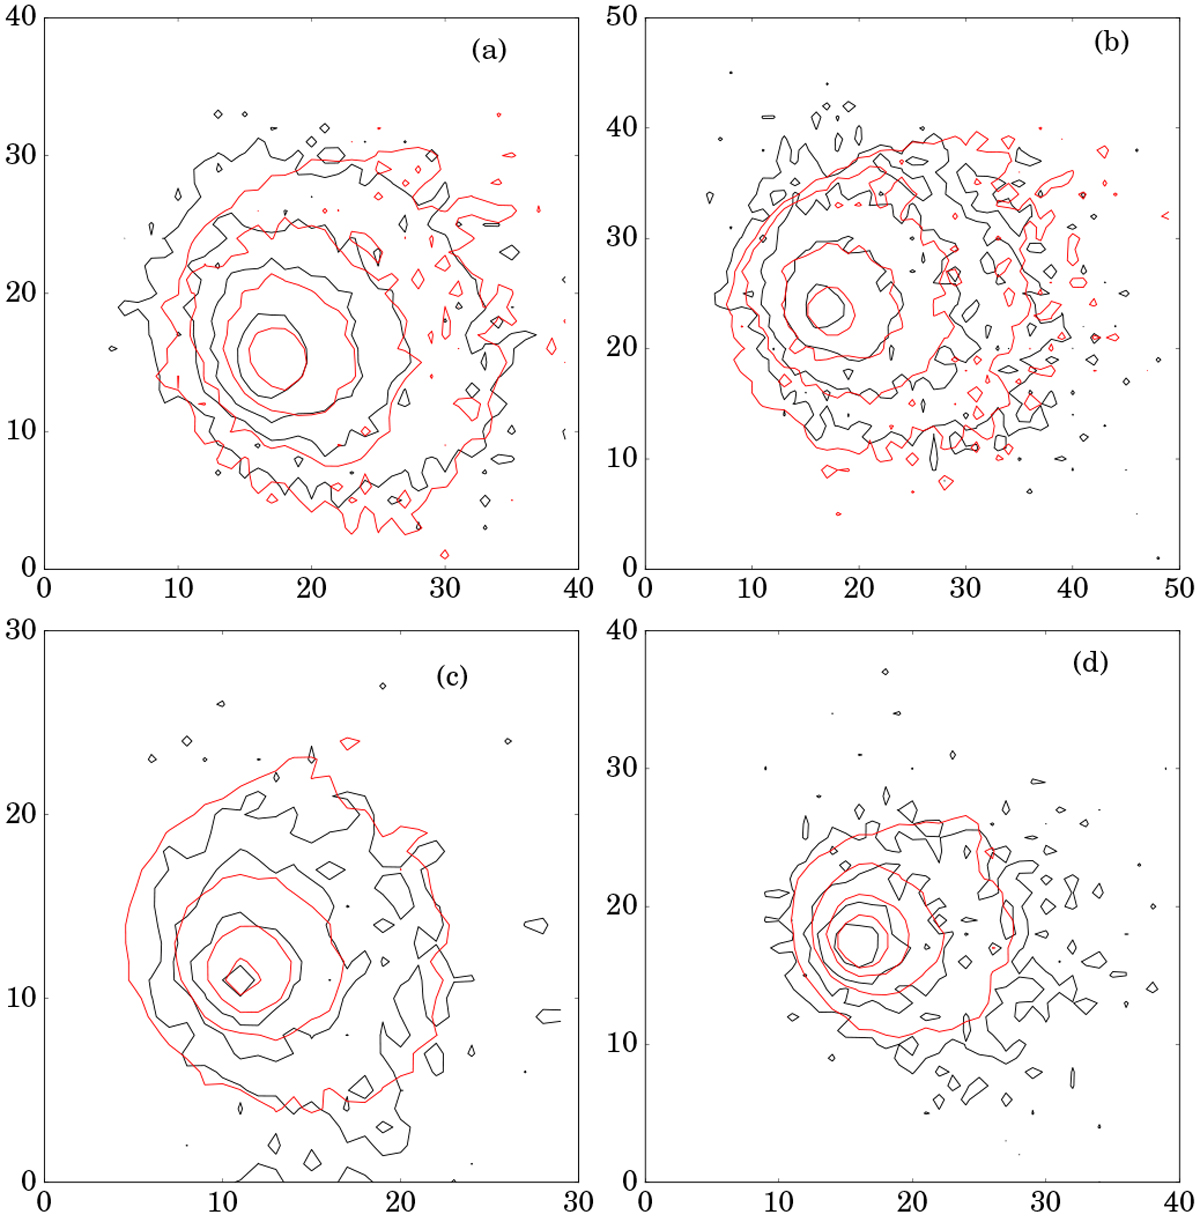
Comparison of four observed (see Table 4) and modeled images. In all cases, the black contours correspond to observations and the red ones to the best-fitting model. The y and x axes are given in units of pixels. The plot is oriented so that north is up and east is to the left.
Current usage metrics show cumulative count of Article Views (full-text article views including HTML views, PDF and ePub downloads, according to the available data) and Abstracts Views on Vision4Press platform.
Data correspond to usage on the plateform after 2015. The current usage metrics is available 48-96 hours after online publication and is updated daily on week days.
Initial download of the metrics may take a while.