Fig. 7
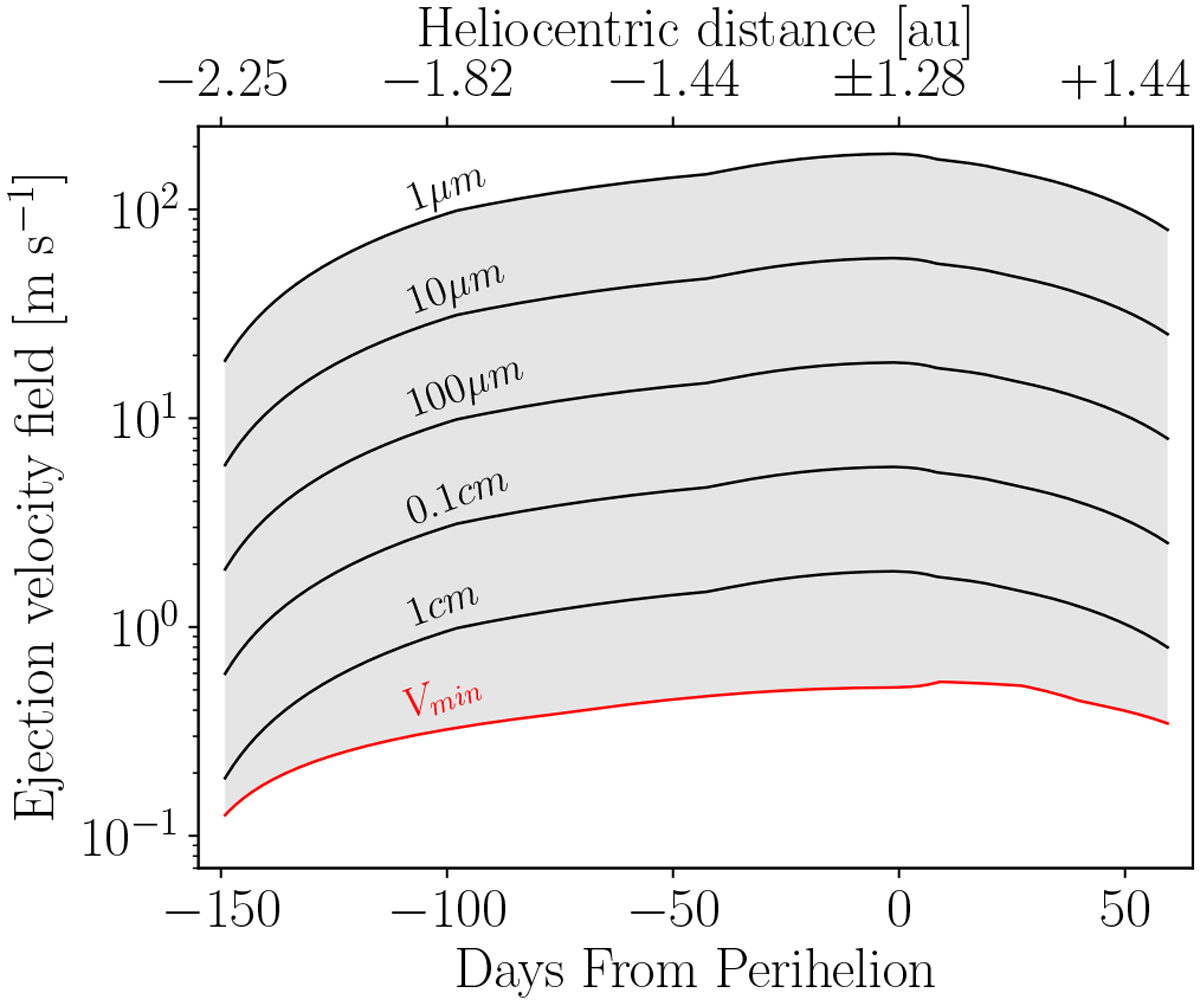
Ejection-velocity field of best-fitting model, as function of heliocentric distance (upper x-axis) and day relative to perihelion (lower x-axis). The velocities of the 1 μm, 10 μm, 100 μm, 0.1 cm, and 1 cm sized particles are shown. The slowest velocity in the model is red-labeled as Vmin, which corresponds to the largest particles at any moment (from 2 to 15 cm).
Current usage metrics show cumulative count of Article Views (full-text article views including HTML views, PDF and ePub downloads, according to the available data) and Abstracts Views on Vision4Press platform.
Data correspond to usage on the plateform after 2015. The current usage metrics is available 48-96 hours after online publication and is updated daily on week days.
Initial download of the metrics may take a while.