Open Access
Fig. 7.
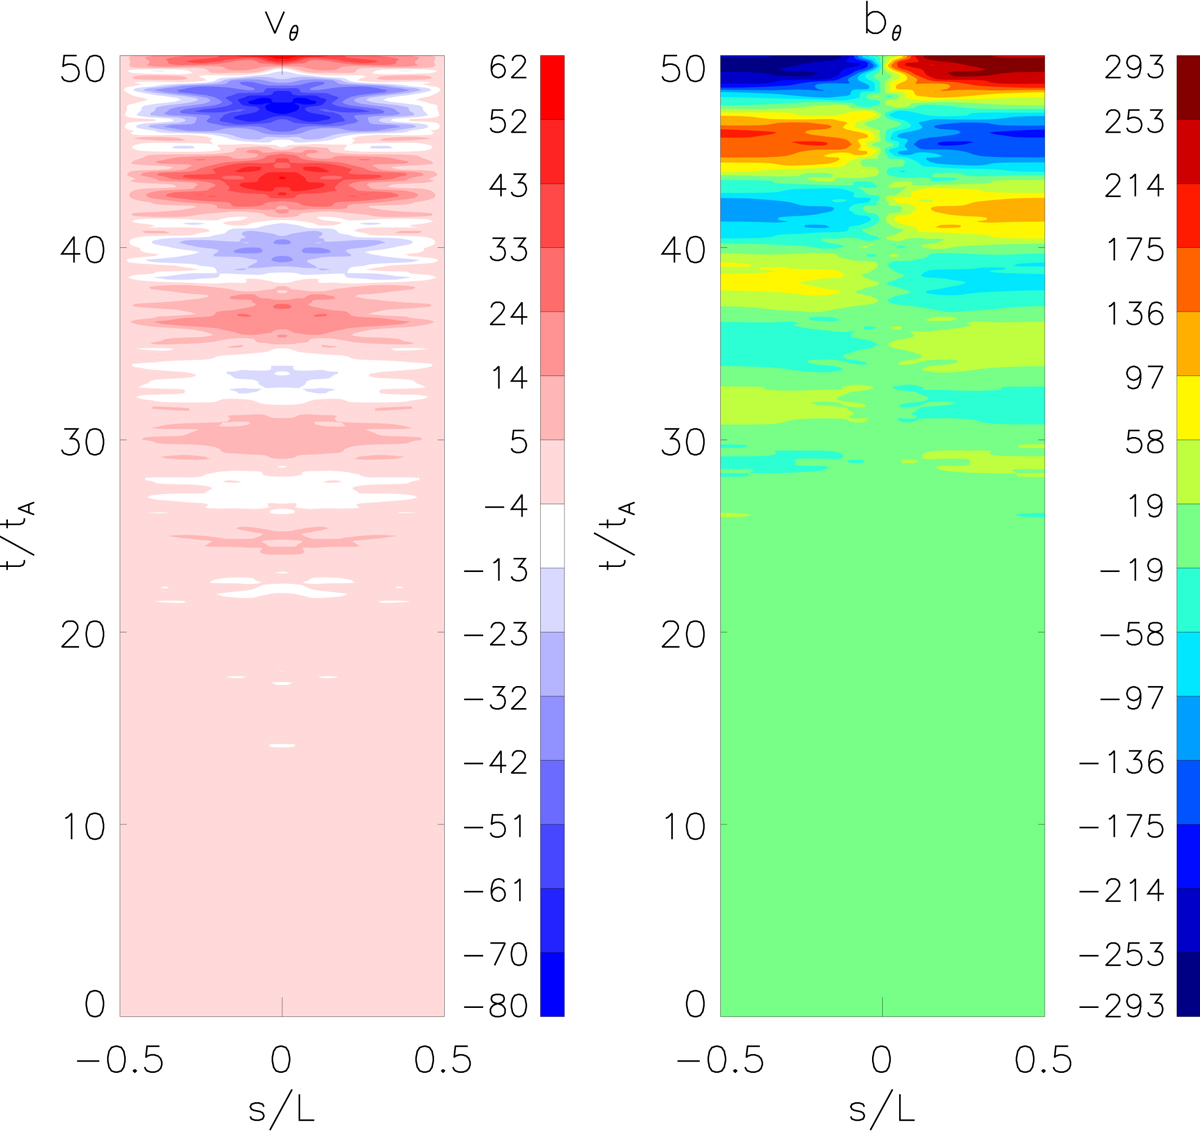
Case IV: spatial-temporal evolution of vθ (left panel) and bθ (right panel) during mass condensation. The perturbations are measured in arbitrary units. A random driver represented by the red curve in Fig. 3 is applied at the footpoints.
Current usage metrics show cumulative count of Article Views (full-text article views including HTML views, PDF and ePub downloads, according to the available data) and Abstracts Views on Vision4Press platform.
Data correspond to usage on the plateform after 2015. The current usage metrics is available 48-96 hours after online publication and is updated daily on week days.
Initial download of the metrics may take a while.