Open Access
Fig. 4.
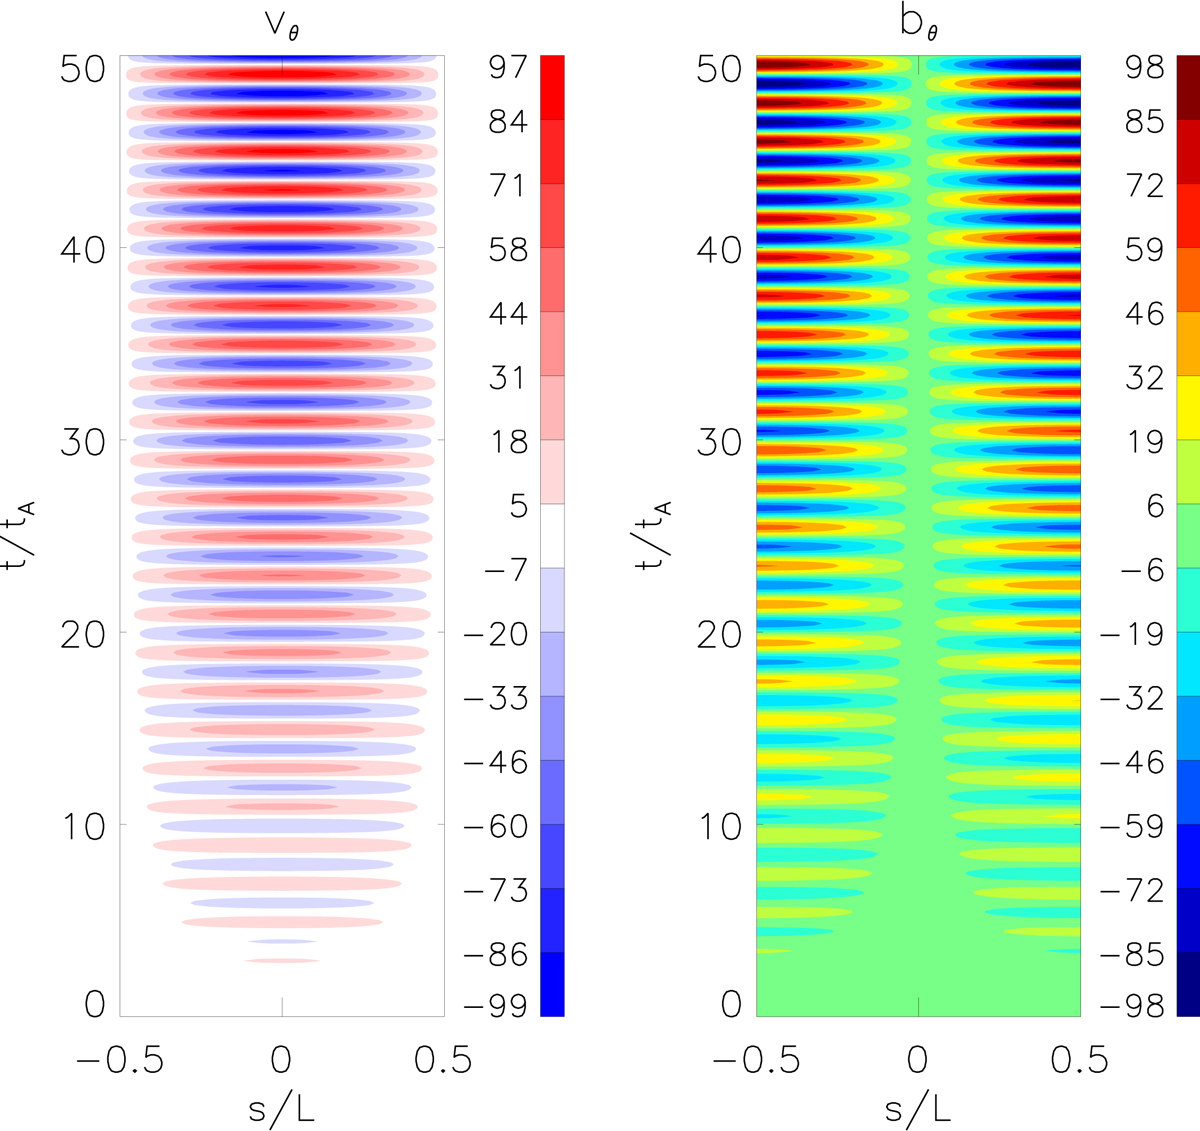
Case I: spatial-temporal evolution of vθ (left panel) and bθ (right panel) in a static background. Colour bars display the range of values in each panel. The perturbations are measured in arbitrary units. A periodic driver with an amplitude of 1 is applied at the footpoints at s = −L/2 and s = −L/2.
Current usage metrics show cumulative count of Article Views (full-text article views including HTML views, PDF and ePub downloads, according to the available data) and Abstracts Views on Vision4Press platform.
Data correspond to usage on the plateform after 2015. The current usage metrics is available 48-96 hours after online publication and is updated daily on week days.
Initial download of the metrics may take a while.