Fig. 2.
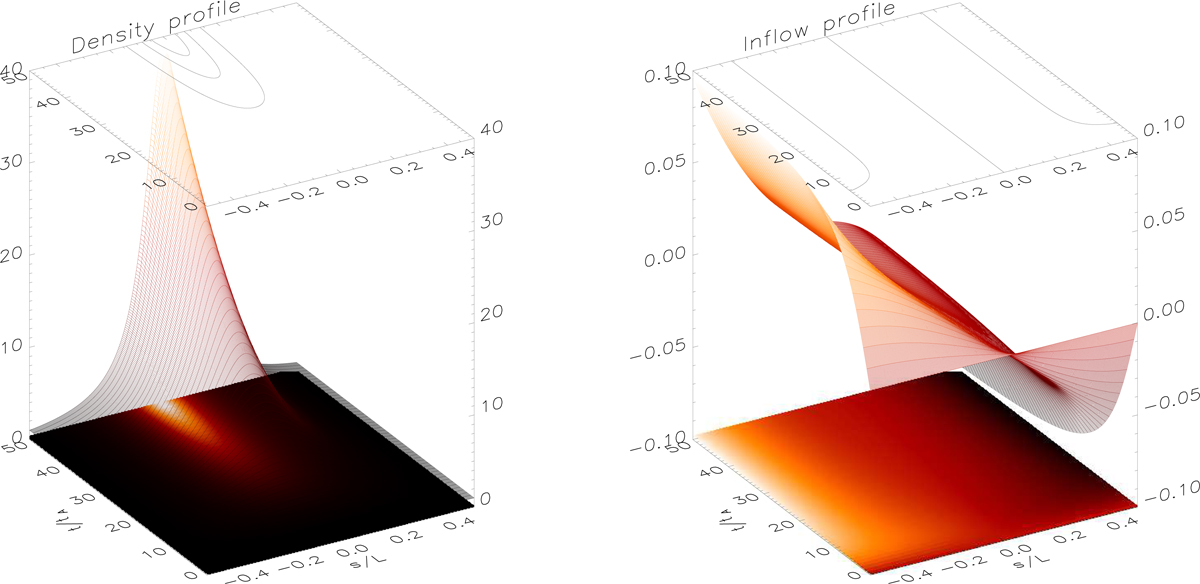
Density (left panel) and flow velocity (right panel) are displayed as functions of time (t/tA) and distance along the thread (s/L). Each plot combines an image (bottom), a surface plot (middle), and a contour plot (top) of the corresponding quantity. Density is normalised with respect to its initial value, ρ0. The velocity of the flow is normalised with respect to initial Alfvén speed, cA0.
Current usage metrics show cumulative count of Article Views (full-text article views including HTML views, PDF and ePub downloads, according to the available data) and Abstracts Views on Vision4Press platform.
Data correspond to usage on the plateform after 2015. The current usage metrics is available 48-96 hours after online publication and is updated daily on week days.
Initial download of the metrics may take a while.