Fig. 4
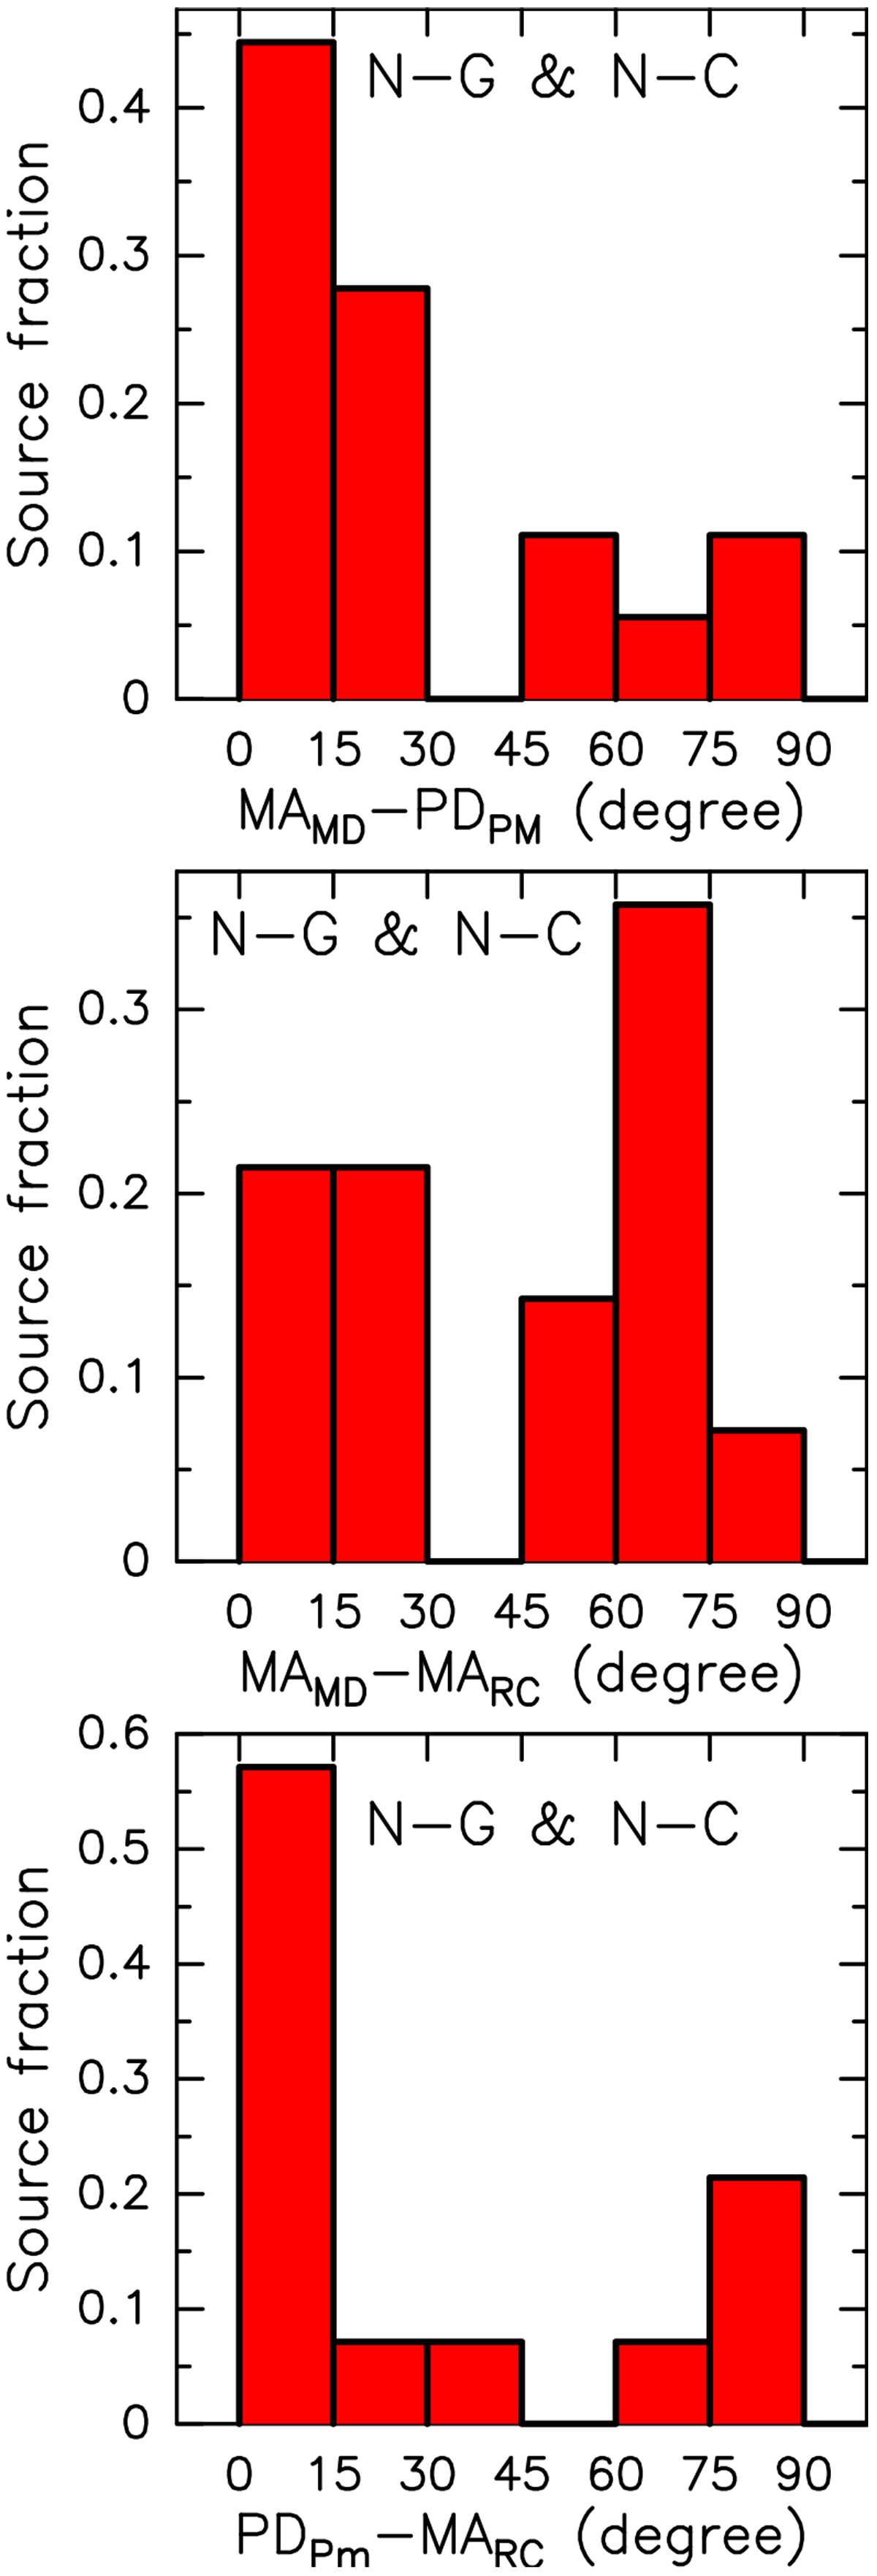
Histograms of the difference between the PA of the major-axis of the maser distribution, MAMD, and the PA of the preferential direction of the maser PMs, PDPM (upper panel), between MAMD and the PA of the major-axis of the radio continuum emission, MARC (middle panel), and between PDPM and MARC (lower panel). To produce these histograms we have selected all the POETS targets belonging to the combined subgroups N-C and N-G (see Table A.1). The histogram bin is 15° and the histogram values are normalized by the total number of considered targets. The source-average errors on the differences MAMD −PDPM, MAMD −MARC, and PDPM−MARC are 26°, 21°, and 24°, respectively.
Current usage metrics show cumulative count of Article Views (full-text article views including HTML views, PDF and ePub downloads, according to the available data) and Abstracts Views on Vision4Press platform.
Data correspond to usage on the plateform after 2015. The current usage metrics is available 48-96 hours after online publication and is updated daily on week days.
Initial download of the metrics may take a while.