Fig. 3
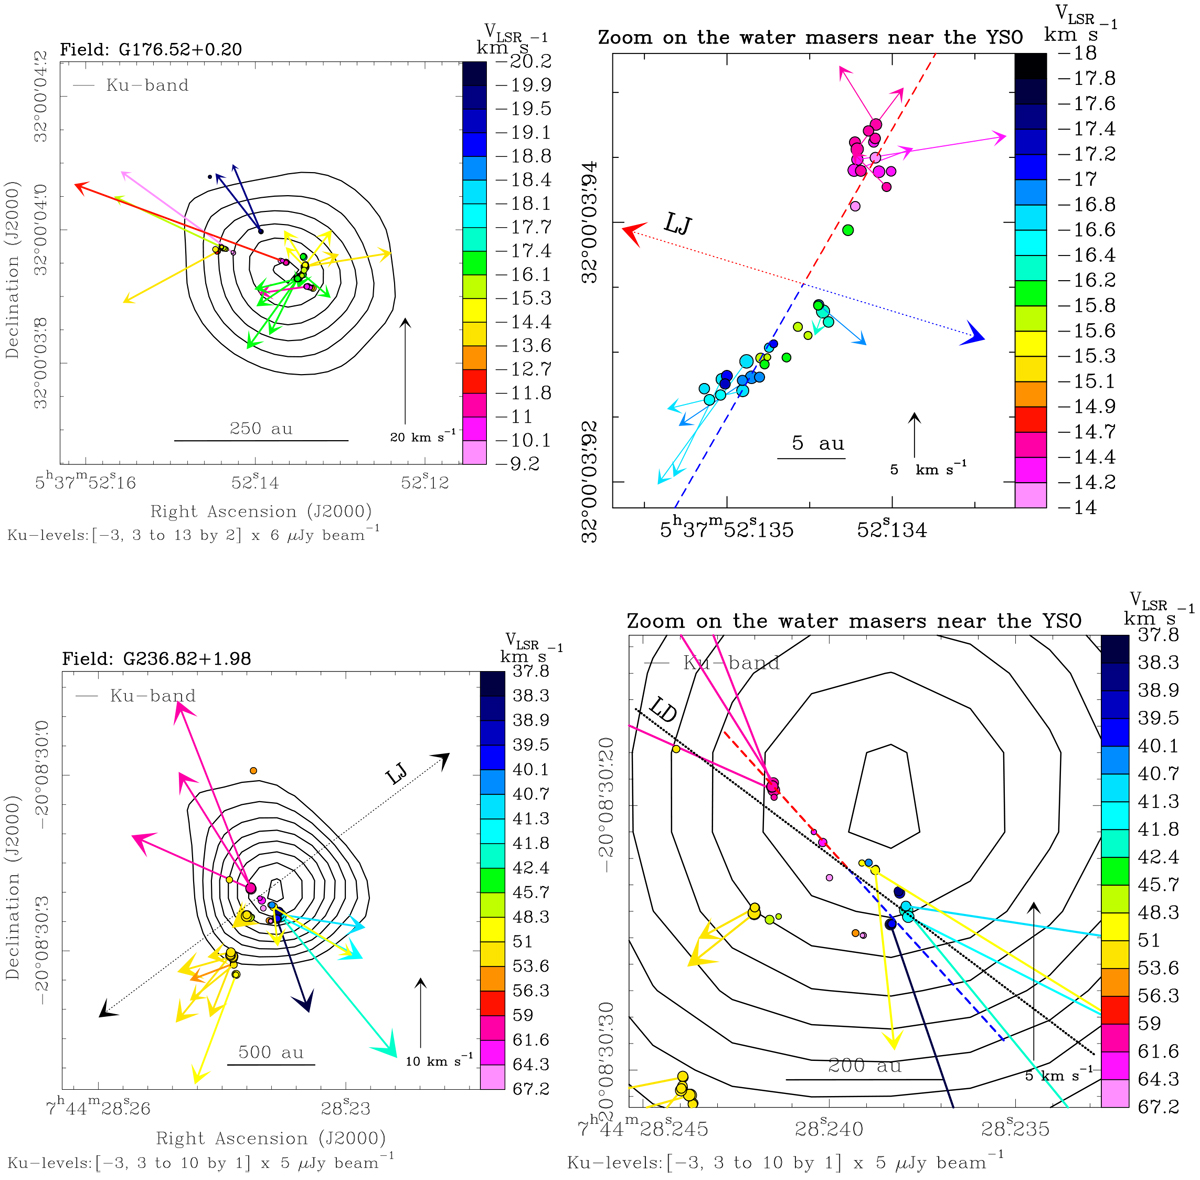
Upper panels: large view (left) and zoom on the water maser kinematics near the YSO (right) for the source G176.52+0.20. In each panel, black contours, and colored dots and arrows have the same meaning as in the upper panel of Fig. 1. The VLSR scale of the left and right panels is different. The VLSR gradient traced by the water masers is indicated by a dashed line, using colors to denote the red- and blue-shifted side of the gradient. The dotted arrows labeled LJ give the axis of the collimated 12CO outflow observed with the SMA by Fontani et al. (2009), using colors to distinguish the red- and blue-shifted flow lobe. Lower panels: large view (left) and zoom on the water masers near the YSO (right) for the source G236.82+1.98. The VLSR gradient traced by the water masers is indicated by a dashed line, using colors to denote the red- and blue-shifted side of the gradient. The black dotted arrows labeled LJ (left) and the black dotted line labeled LD (right) denote the orientations of the elongated chain of H2 2.2 μm knots and the extinction lane in the J-band image, respectively, observed in proximity of G236.82+1.98 by Varricatt (2012), using the Wide Field Camera mounted on the 3.8 m UKIRT.
Current usage metrics show cumulative count of Article Views (full-text article views including HTML views, PDF and ePub downloads, according to the available data) and Abstracts Views on Vision4Press platform.
Data correspond to usage on the plateform after 2015. The current usage metrics is available 48-96 hours after online publication and is updated daily on week days.
Initial download of the metrics may take a while.